

Prosperity Unabated,
Refinement Sustains the Premium:
26H1 Review & Prospect
Prosperity Unabated,
Refinement Sustains the Premium:
26H1 Review & Prospect


Examining widening performance divergence as luxury enters a new phase of value validation, with pricing power increasingly anchored in earnings quality and operational resilience.
[2026H1 in a Nutshell]
[2026H2 Outlook]
High-net-worth consumption continued to benefit from global asset appreciation, while aspirational demand among middle-income consumers and broader discretionary spending became increasingly restrained. Currency headwinds, inventory pressure, and intensifying promotional activity further widened the gap between stronger and weaker operators. As a result, the market shifted from assigning premiums to brand narratives toward rewarding demonstrable full-price sell-through, margin resilience, and cash-flow delivery.
Within this environment, more rigorous valuation scrutiny at the primary-index level, K-shaped divergence across the secondary indices, and the increasing convergence of stock-level pricing around operating evidence defined the sector’s central evolution during the first half of 2026.
More specifically, after a brief recovery at the beginning of the year, the market applied a materially higher threshold to earnings certainty across the luxury sector. Although the primary index initially advanced before reversing and ultimately closing lower, this did not signal a broad deterioration in fundamentals. Rather, the limited improvement in operating performance proved insufficient to sustain a higher valuation range. Investors became less willing to price in recovery expectations indiscriminately, shifting their focus toward current earnings quality, cash conversion, and the credibility and timing of delivery.
At the secondary-index level, relative performance was shaped by the interaction of customer resilience and business-model visibility. Within Core Luxe, the jewelry and watches sector outperformed the fashion and leather goods sector: jewelry benefited from its value-retention attributes and gifting demand, while the fashion and leather goods sector remained constrained by weaker traffic, inventory pressure, and creative transitions. Ultra Luxe, by contrast, demonstrated stronger defensive characteristics through long-duration order books, customization revenue, and structurally constrained supply.
Mass Luxe remained the most exposed to middle-income purchasing power and channel inventories. Beauty and fragrance sustained growth through repeat purchasing and product innovation, but this resilience was insufficient to offset spirits destocking and softer demand across home-related categories. Experiential Luxe, meanwhile, was supported by cruises, hospitality, gaming, and art transactions, once again highlighting the structural resilience of experience-led expenditure.
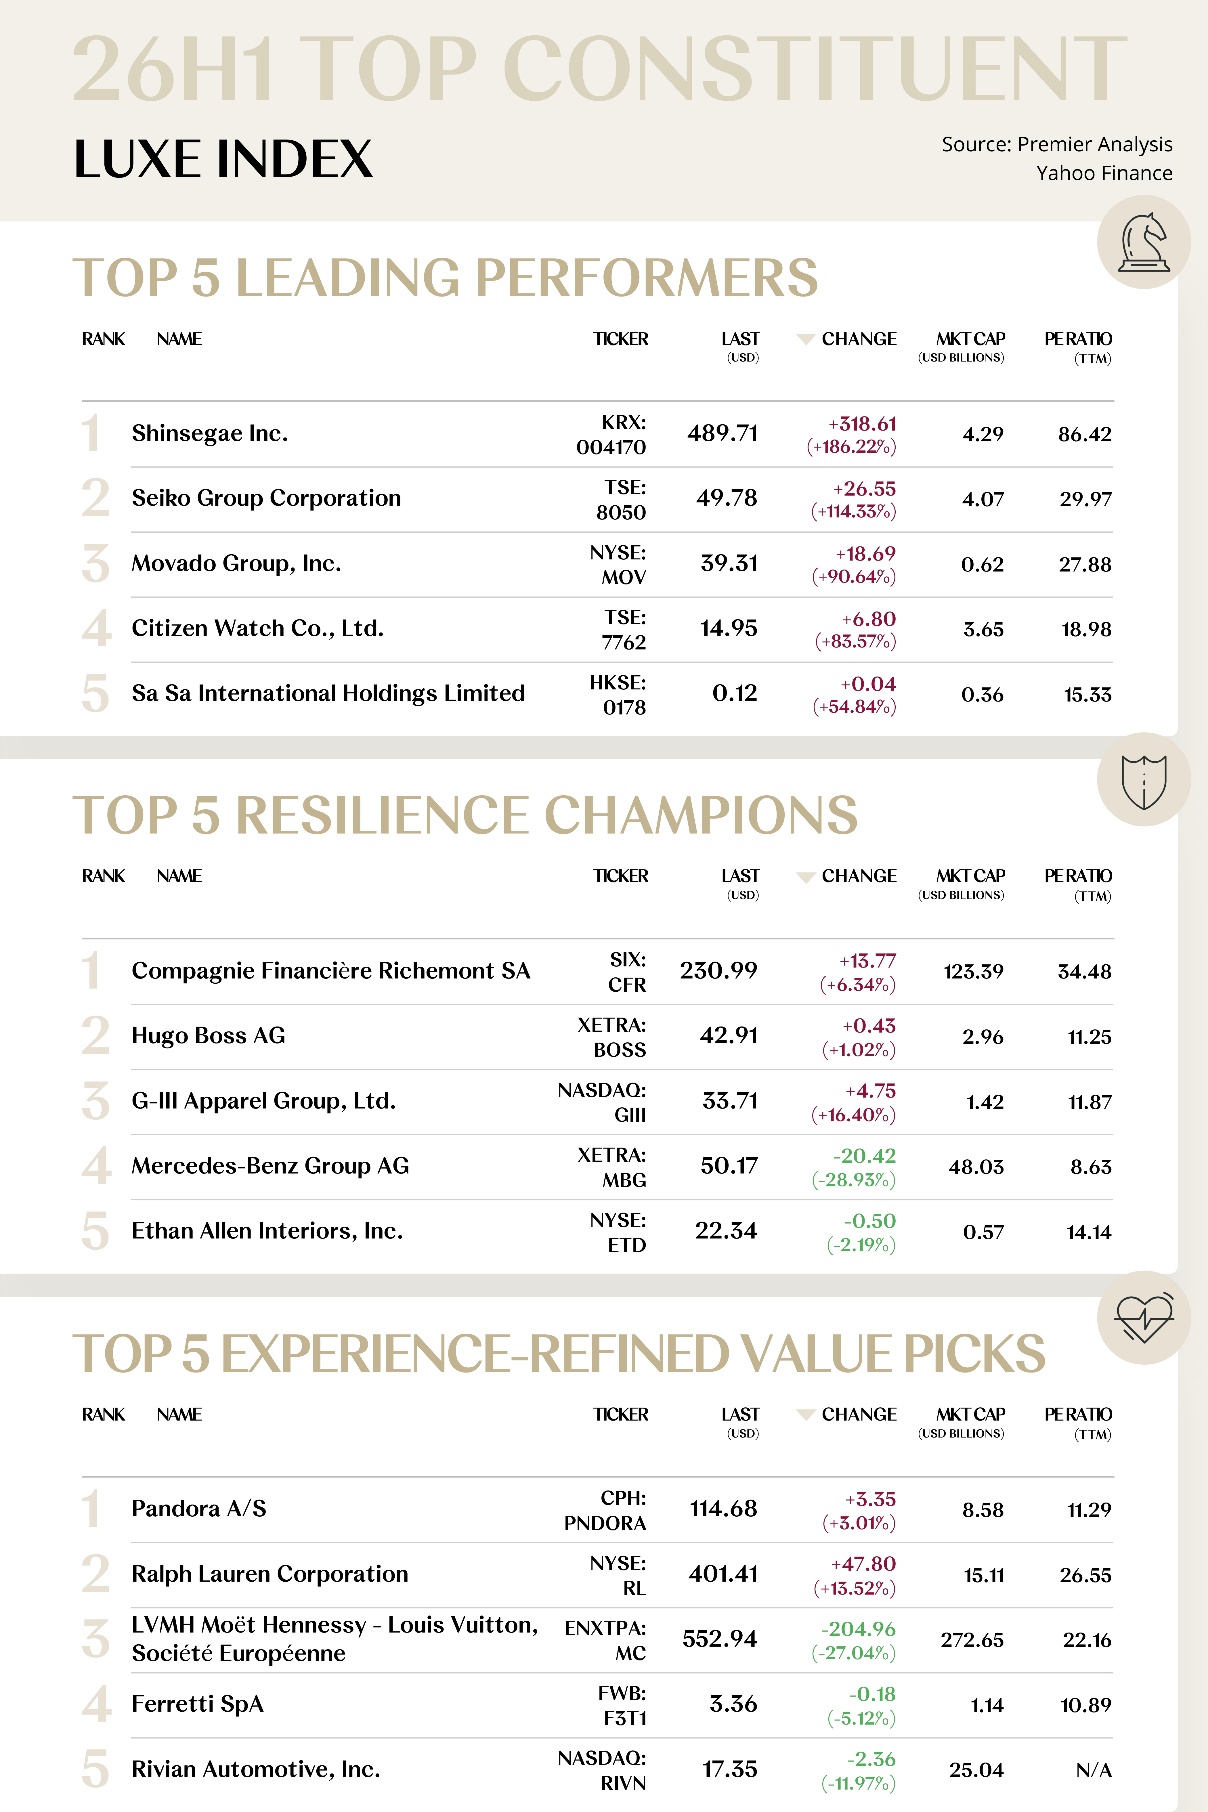
As divergence intensified, capital allocation became increasingly concentrated among a narrower group of assets offering verifiable resilience. Leading Performers outperformed through earnings recovery and the release of operating leverage. Mid-tier Stocks names preserved valuation support through disciplined full-price distribution, dependable cash generation, and shareholder returns. Tail-end Stocks, weaker demand, inventory normalization, and elevated investment requirements combined to create a negative feedback loop of slowing revenue, mounting margin pressure, and continued valuation compression.
Within this framework, Leading Performers such as Shinsegae, Seiko, Movado, Citizen Watch, and Sa Sa International emerged as clear market standouts and became focal points for capital allocation.
From a macro perspective, continued gains across global equity markets sustained the wealth effect and provided tangible support to high-net-worth consumption, while the recovery in cross-border mobility reinforced travel retail and experience-led spending. These tailwinds were offset by the combined effects of conflict in the Middle East, higher oil prices, rising European interest rates, and adverse currency translation. At the same time, subdued domestic demand in China further widened performance dispersion across regions and customer segments.
Taken together, the macro environment did not generate a uniform sector-wide uplift. Instead, the interaction of wealth effects, interest rates, currency movements, and geopolitical risk reshaped the industry’s relative performance hierarchy, leaving the luxury sector in a regime defined by underlying resilience but increasingly pronounced divergence.
Looking ahead to the second half of 2026, the dominant index narrative is expected to shift from valuation validation toward earnings delivery. With macro headwinds yet to recede fully and operating performance continuing to diverge, capital markets are likely to become less tolerant of traffic-recovery narratives and brand storytelling unsupported by financial evidence. Valuation anchors should therefore become more firmly tied to full-price sell-through, margin resilience, free-cash-flow generation, and execution credibility.
Accordingly, further index upside is more likely to arise from the stabilization and selective expansion of valuation ranges supported by demonstrable operating progress, rather than from a broad-based return to historical multiples. Companies capable of converting traffic consistently into earnings and cash flow are therefore better positioned to become the principal contributors to index resilience.
Against a backdrop of persistent currency volatility and a higher threshold for earnings delivery, divergence across the secondary indices is likely to remain pronounced. Within Core Luxe, a recovery in fashion and leather goods—supported by continued resilience in jewelry and established iconic products—could create the conditions for renewed leadership. Ultra Luxe, by contrast, should retain its defensive role and strategic allocation appeal through long-duration order books, structurally scarce supply, and comparatively low price sensitivity.
For Mass Luxe, the key variables remain the cyclical progression of its core categories. Completion of channel destocking in spirits, combined with sustained new-product productivity in beauty and fragrance, could move the segment from stabilization toward gradual recovery. Experiential Luxe should remain comparatively more predictable, supported by resilient demand across premium travel, hospitality, and cruises. Its performance, however, will depend increasingly on the balance among capacity expansion, booking visibility, unit revenue, capital intensity, and cost discipline.
Investor attention is expected to remain highly concentrated, with capital allocation tilting further toward assets offering verifiable certainty. High-resilience names such as Richemont, Mercedes-Benz, Embraer, L’Oréal, and Hilton should remain well positioned to command valuation premiums through strong brand and order-book barriers, disciplined full-price distribution, robust balance sheets, and dependable cash returns.
For Experience-Refined Value Picks including Pandora, Ralph Lauren, LVMH, Royal Caribbean, and Hyatt, the valuation case will depend on whether product innovation, occasion-based engagement, and customer connectivity can be translated into repeatable growth engines. Critical evidence will include the contribution of new products to average transaction value and repeat purchasing, improvements in channel and booking efficiency, and the conversion of organizational execution, resource allocation, and expansion investment into earnings and free cash flow. Collectively, these factors will determine whether individual names can progress from cyclical recovery toward structural growth.
By comparison, less differentiated brands and companies with weaker channel control are likely to remain exposed to elevated operating friction. Limited demand resilience, combined with inventory pressure, discounting, and high fixed costs, may continue to constrain revenue quality and limit the pace of margin recovery.
At the macro level, oil prices, European interest rates, currency movements, renminbi-denominated wealth effects, and Chinese outbound travel will remain the principal variables shaping the sector’s underlying demand foundation. An easing of geopolitical and energy pressures, together with stable major asset prices, could provide incremental support to high-end consumption and sector valuations. Uneven global growth, subdued domestic demand in China, and recurring trade-policy uncertainty will nevertheless continue to elevate the sector’s volatility profile.
As cross-border consumption and global distribution networks continue to recover, macro sensitivity will become increasingly concentrated in currency pass-through and shifts in regional supply-demand conditions. Brands will therefore need to manage global price architecture, regional product allocation, and inventory cadence dynamically, while simultaneously optimizing supply chains, production planning, and capital deployment. These capabilities will be essential to absorbing external shocks, protecting gross-margin structures, and sustaining long-term brand momentum.
DOWNLOADS

Lite Report (107 pages)

CORE LUXE CONSTITUENT ZOOM-IN
Brand Renewal and Tighter Channel
Control Improve Operating Quality and
Strengthen the Basis for Rerating
The Core Luxe Index comprises 11 companies.
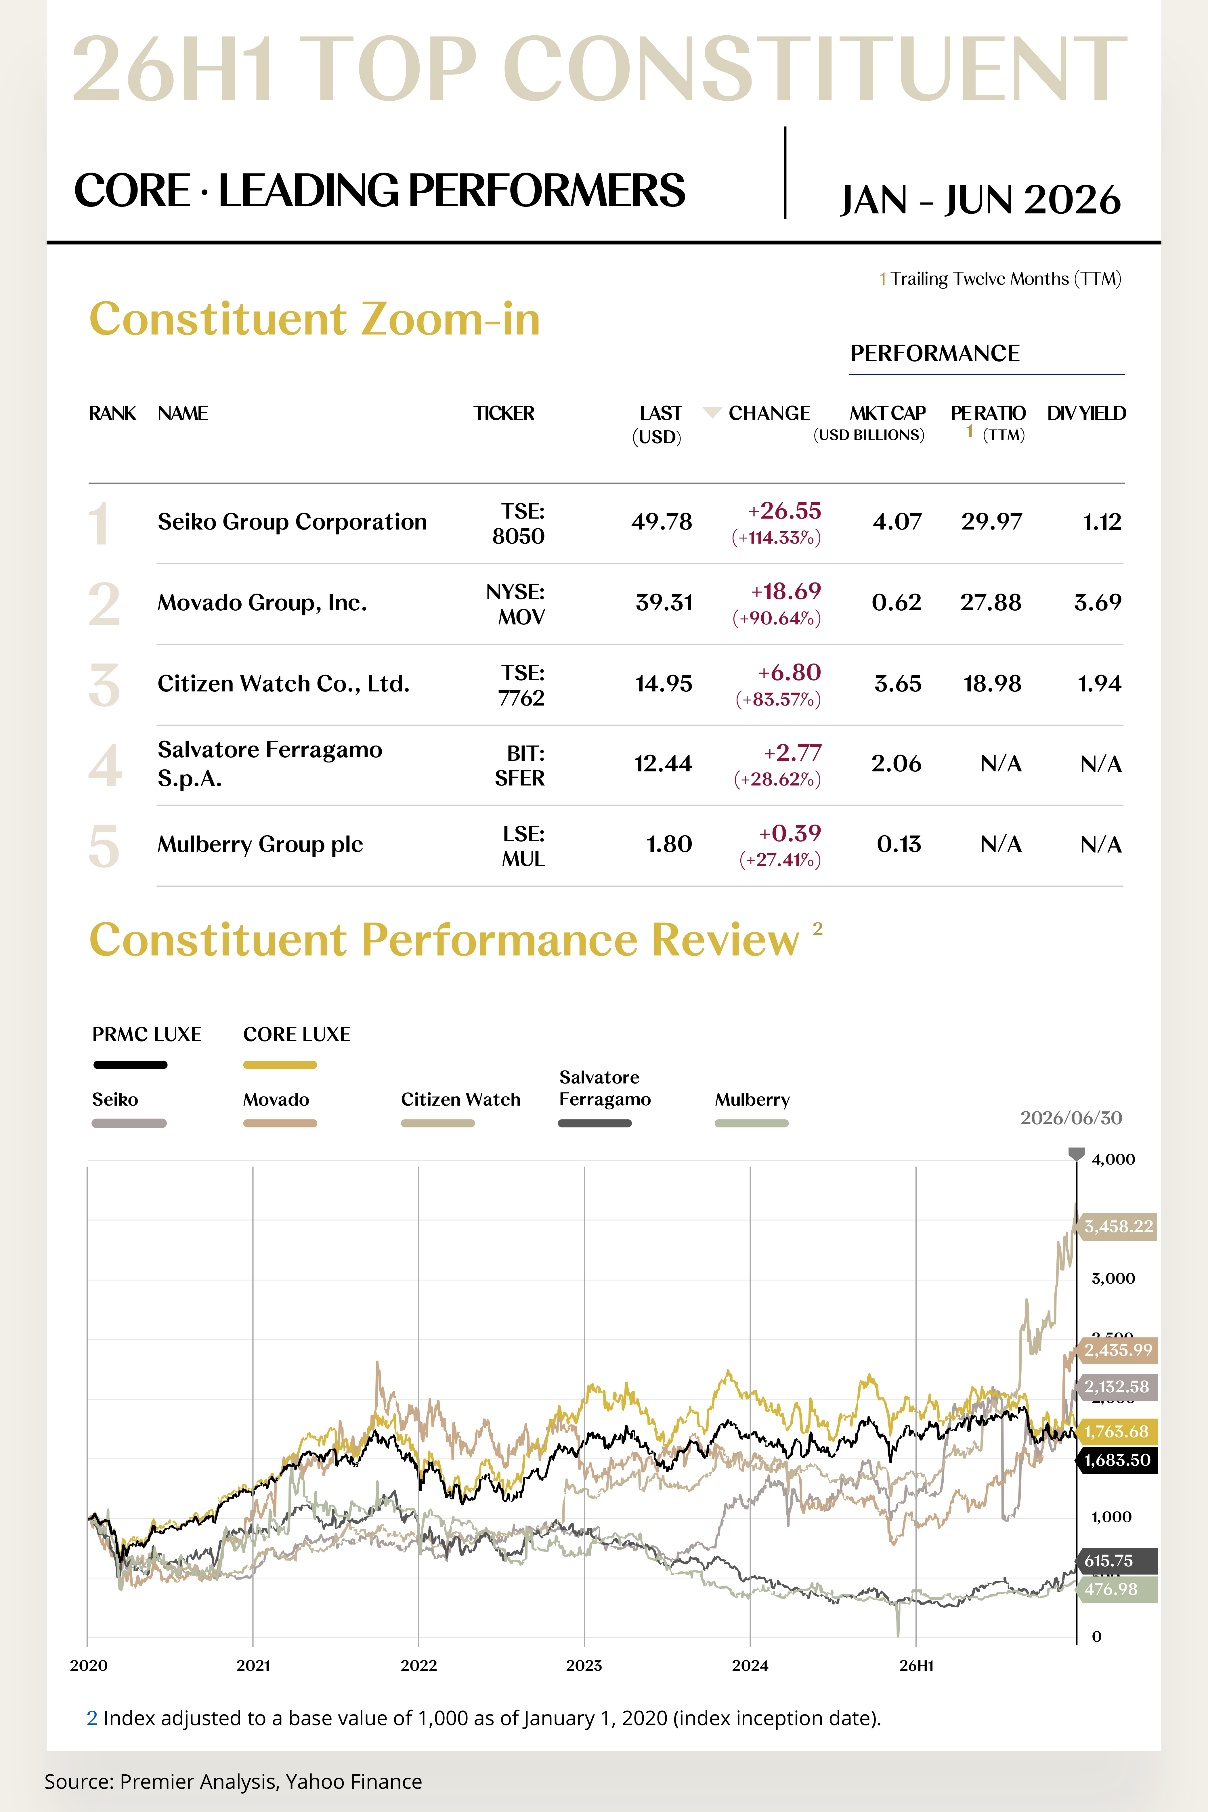
Leading Performers
1. Seiko Group Corporation (TSE: 8050)
Seiko Group Corporation is a diversified Japanese watchmaking and precision-technology group. Its portfolio spans Grand Seiko, Seiko Prospex, Presage, and Seiko 5 Sports, alongside electronic devices and systems solutions. In H1 2026, the company’s share price rose from US$23.22 to US$49.78, an increase of US$26.55, or 114.33%.
For the fiscal year ended March 2026, the Group reported revenue of JPY 335.686 billion, up 10.2% year over year; operating profit of JPY 30.873 billion, up 45.4%; and net income attributable to owners of the parent of JPY 21.980 billion, up 65.1%. Revenue, earnings, and returns on capital strengthened concurrently.
Growth was driven by a recovery for Grand Seiko in Japan, solid performance in the United States, and global brands including Prospex, Presage, and Seiko 5 Sports. The Emotional Value Solutions segment generated revenue of JPY 220.4 billion and operating profit of JPY 28.5 billion, increases of 10.7% and 28.7%, respectively.
Further rerating in H2 2026 will require continued growth in global brand sales, a higher international revenue mix, and sustained margin improvement. The company forecasts revenue of JPY 358.0 billion and operating profit of JPY 33.5 billion for the fiscal year ending March 2027. Foreign-exchange movements, precious-metal costs, and the pace of high-end consumer spending will remain the principal factors to monitor.
2. Movado Group, Inc. (NYSE: MOV)
Movado Group is a U.S. premium and accessible-luxury watch company. It operates owned brands including Movado and MVMT and manages licensed watch businesses for Coach and Tommy Hilfiger, combining brand ownership, channel execution, and an asset-light licensing model. In H1 2026, the company’s share price rose from US$20.62 to US$39.31, an increase of US$18.69, or 90.64%.
Fourth-quarter FY2026 net sales reached US$191.6 million, up 5.6% year over year, while operating income increased 49.7% to US$13.8 million. The company subsequently reported first-quarter FY2027 net sales of US$142.4 million, operating income of US$7.0 million, and adjusted EPS of US$0.32, indicating that earnings held up better than the topline.
Movado raised its quarterly dividend to US$0.40 per share and continued to direct capital toward strengthening its owned brands, expanding digital direct-to-consumer channels, controlling inventory, and refining its licensing portfolio. Its relatively light asset base and strong cash returns allow operating gains to translate more quickly into cash available to shareholders.
The H2 2026 rerating case rests on continued improvement in full-price sales, gross margin, and inventory turnover. If growth in owned brands increasingly offsets volatility in the licensed business, Movado could progress from a cyclical recovery story toward a more durable brand-led earnings model with stronger cash-flow visibility.
[For more insights, please download the full report]
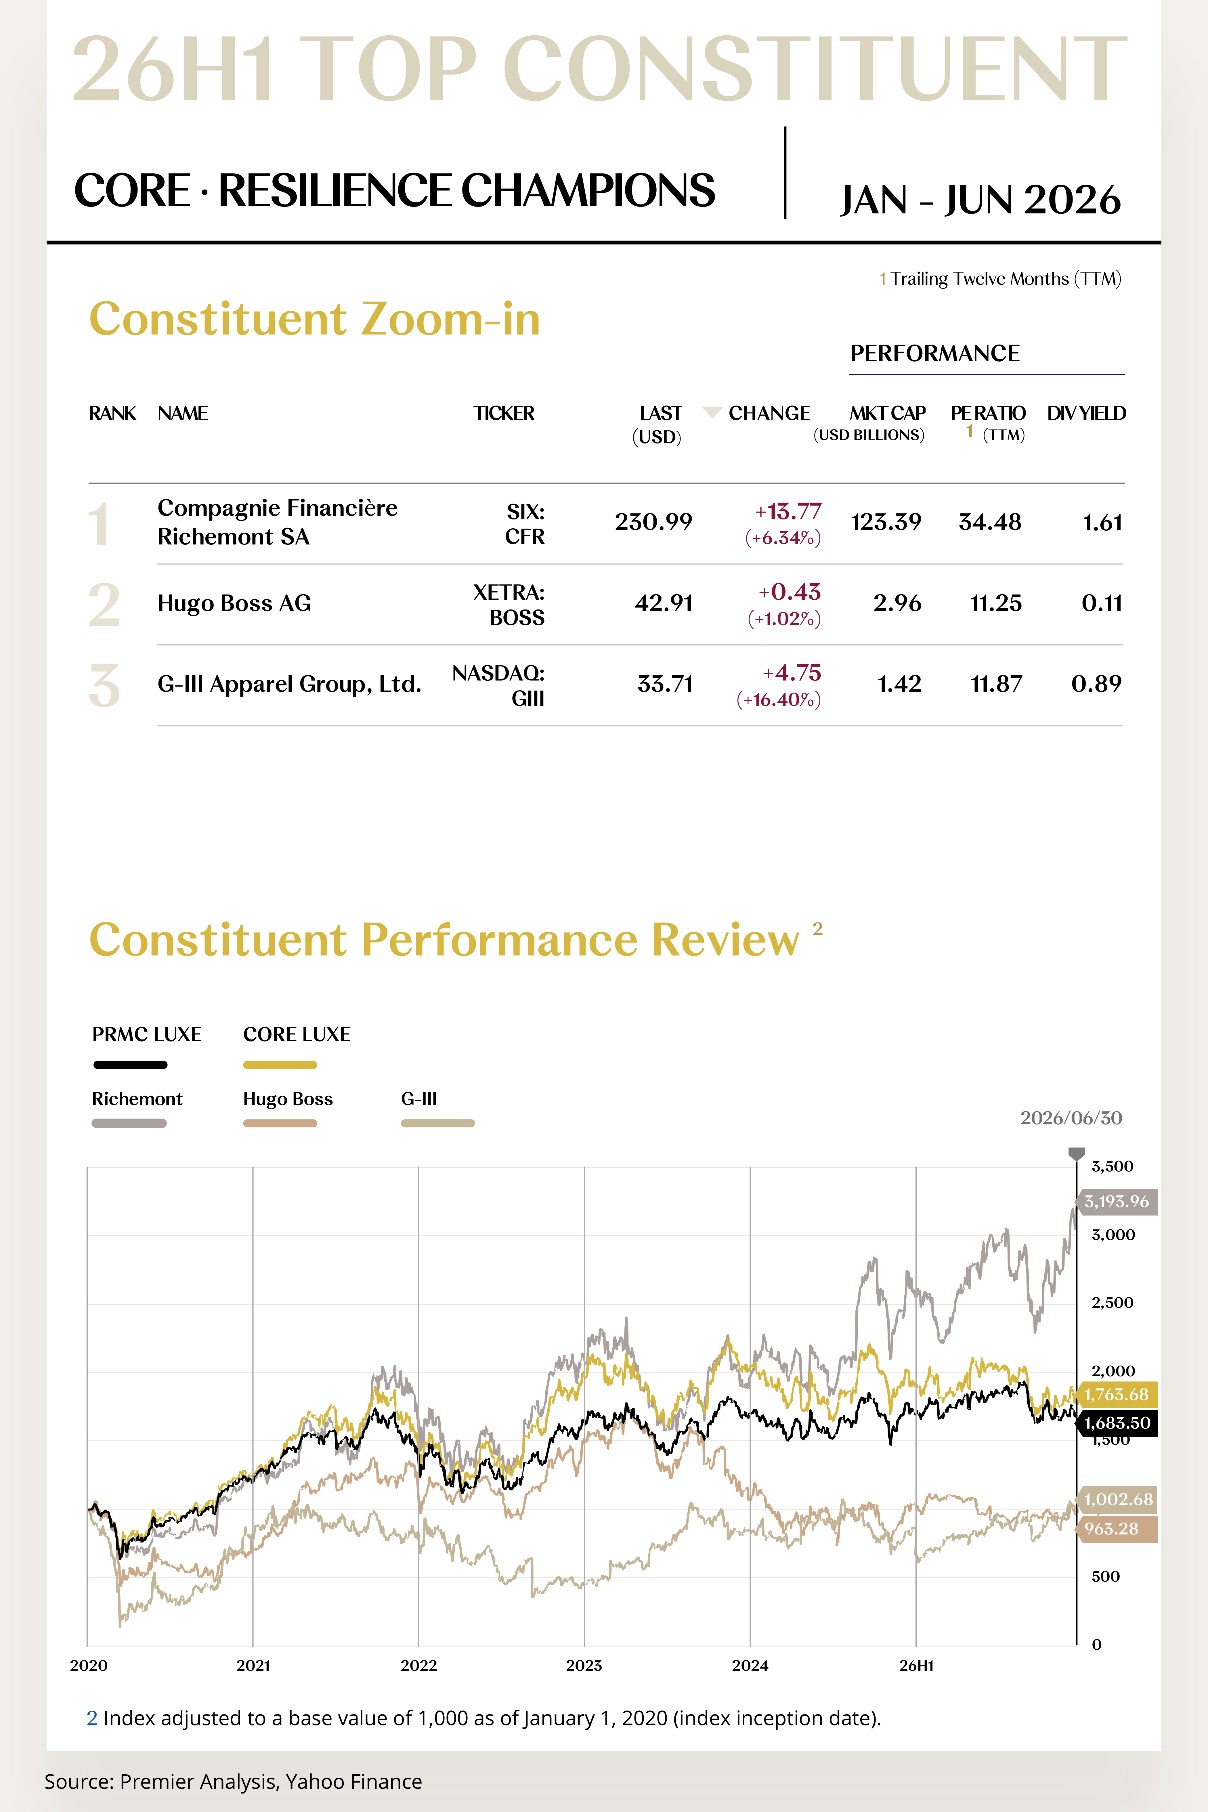
Resilience Champions
1. Compagnie Financière Richemont SA (SIX: CFR)
Richemont is one of the principal global hard-luxury groups, with jewelry maisons including Cartier and Van Cleef & Arpels alongside a portfolio of specialist watchmakers. Scarce brand assets and deeply established relationships with high-net-worth clients underpin a durable competitive advantage. In H1 2026, the company’s share price rose from US$217.23 to US$230.99, an increase of US$13.77, or 6.34%.
For the fiscal year ended March 2026, the Group generated sales of EUR 22.4 billion, up 11% at constant exchange rates; operating profit of approximately EUR 4.5 billion; and net profit of EUR 3.5 billion, up 27% year over year. Net cash at period-end was approximately EUR 8.5 billion. Jewelry remained the primary engine of growth and profitability.
Richemont concentrated resources on its jewelry maisons, boutique network, client experience, and watchmaking product strength. A substantial net-cash position preserves strategic flexibility across acquisitions, inventory investment, and shareholder distributions. A more focused operating portfolio also makes the underlying value of the core maisons more transparent.
Richemont remains one of the more dependable assets in the luxury sector for H2 2026. The principal factors to monitor are the recovery in Chinese demand, a demanding comparison base in jewelry, and inventory normalization in watches. If Cartier and Van Cleef & Arpels sustain full-price sell-through, earnings should remain resilient.
2. HUGO BOSS AG (XETRA: BOSS)
HUGO BOSS is a German premium-fashion group whose BOSS and HUGO brands span business tailoring, casualwear, and younger fashion occasions. Its global directly operated network and digital channels underpin the Group’s commercial platform. In H1 2026, the company’s share price rose from US$42.48 to US$42.91, an increase of US$0.43, or 1.02%.
First-quarter 2026 sales were EUR 905 million, down 6% year over year, while EBIT was EUR 35 million, representing a 3.9% margin. Free cash flow before lease payments improved from negative EUR 66 million a year earlier to positive EUR 33 million, and inventory fell 13%, showing that cash generation and working-capital efficiency improved far more than the revenue trend alone would imply.
The company has entered the execution phase of “CLAIM 5 TOUCHDOWN,” shifting emphasis from rapid expansion toward cost discipline, inventory, store productivity, and returns on brand investment. The dual-brand architecture remains intact, but capital allocation is increasingly tied to measurable profitability and cash recovery.
In H2 2026, HUGO BOSS must show that cost savings are being accompanied by sales stabilization rather than driven solely by contraction. If healthier inventory and improved store efficiency combine with stronger conversion from new products, margins have scope to recover. European consumption and the promotional environment will remain the primary constraints.
[For more insights, please download the full report]
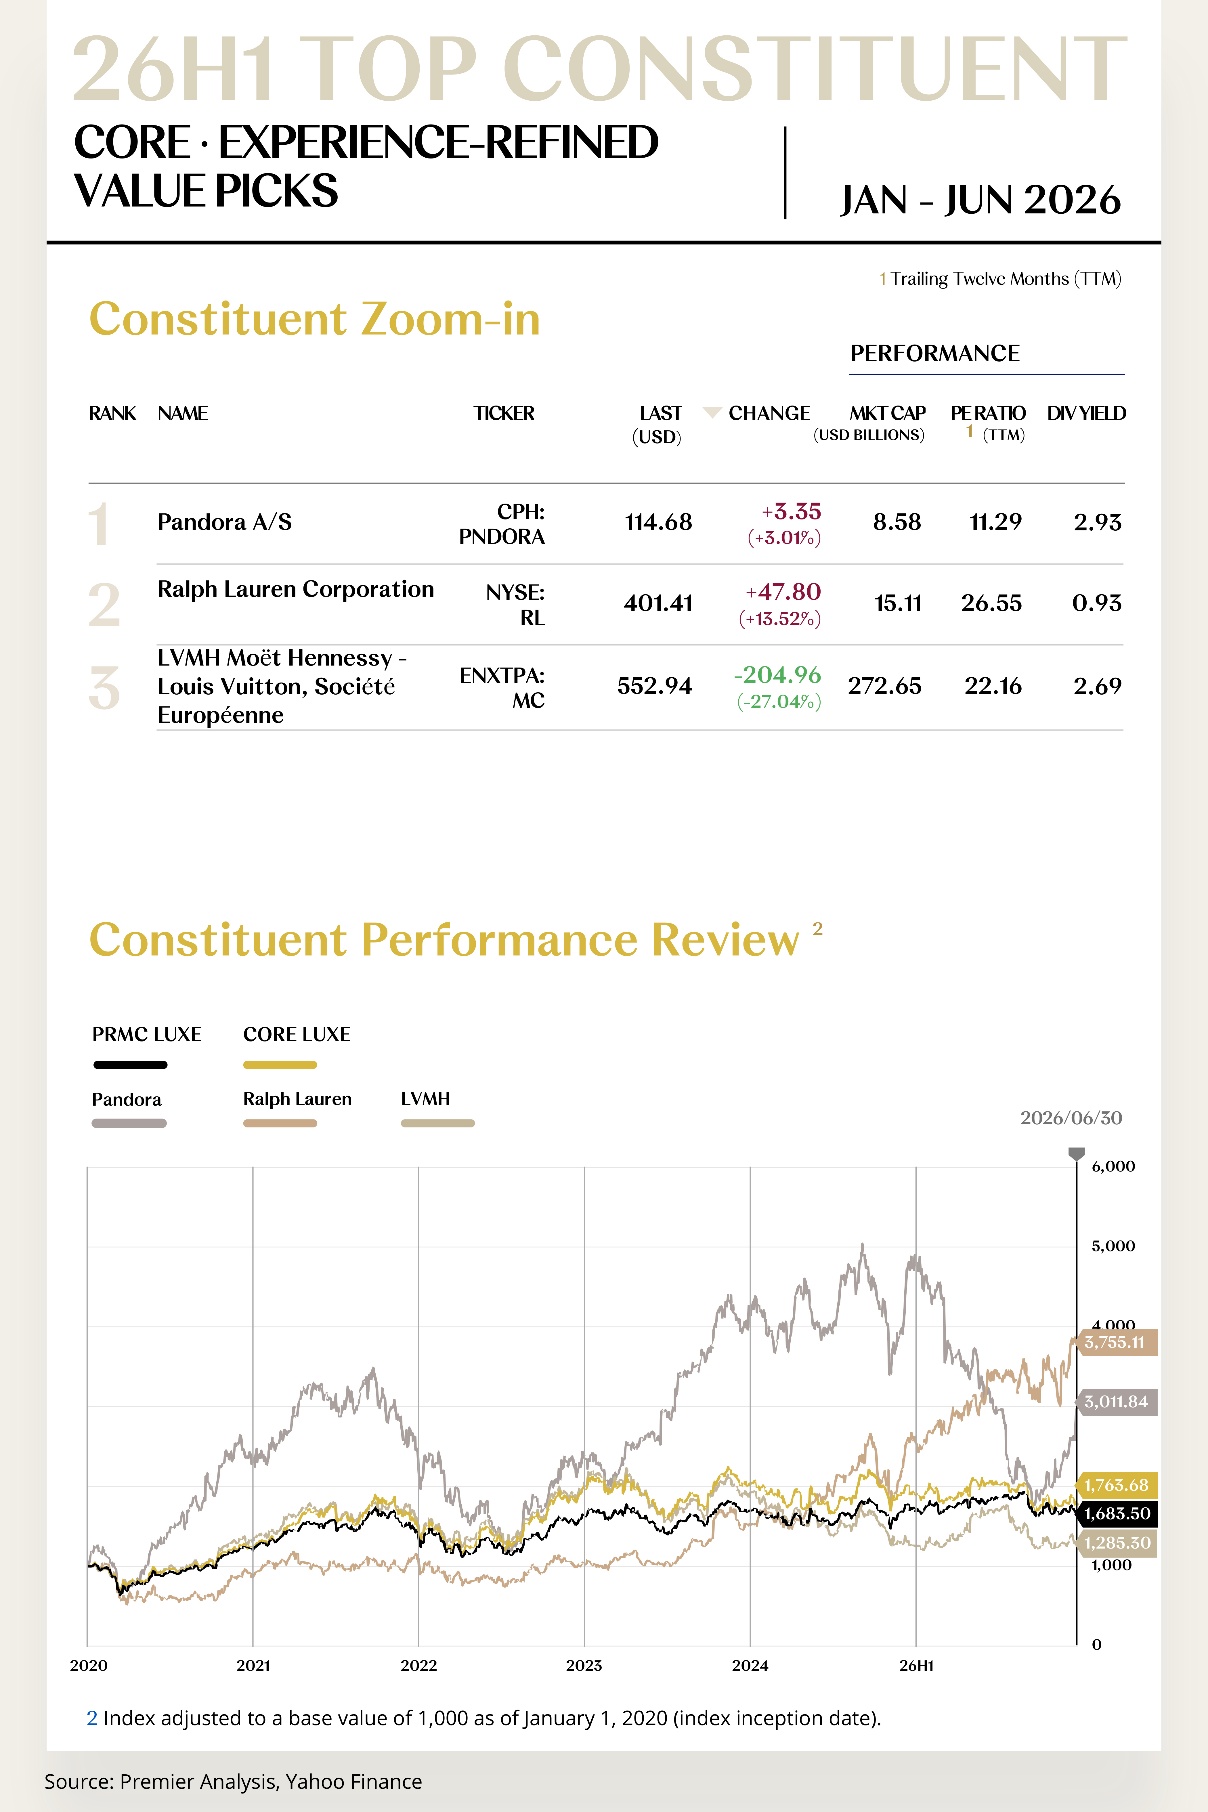
Experience-refined Value Picks
1. Pandora A/S (CPH: PNDORA)
Pandora is one of the world’s largest accessible-jewelry brands. Its charms, bracelets, and customizable products support a high-frequency repeat-purchase model, while a global directly operated network and scaled supply chain provide strong capital efficiency. In H1 2026, the company’s share price rose from US$111.33 to US$114.68, an increase of US$3.35, or 3.01%.
First-quarter 2026 organic growth was 2%, with like-for-like sales flat. Asia-Pacific and Latin America grew 12% and 6%, respectively, while North America and Europe, the Middle East, and Africa each declined 2%. Net debt at period-end was approximately DKK 16.1 billion and leverage was 1.6 times, leaving financial capacity for expansion and shareholder returns.
Pandora continued to advance its Phoenix strategy through brand renewal, lab-grown diamonds, store-network expansion, and a more diversified product platform, reducing dependence on classic charms. Marketing effectiveness and new-product penetration will determine whether the company can broaden beyond a scaled jewelry retailer into a more diversified platform for gifting and self-purchase.
In H2 2026, Pandora needs to restore like-for-like growth in mature markets and demonstrate that new products can lift average transaction value and repeat purchase. If network expansion outpaces demand recovery, costs and working capital could come under pressure. Conversely, a successful brand upgrade would provide a more durable foundation for the valuation.
2. Ralph Lauren Corporation (NYSE: RL)
Ralph Lauren is a classic American lifestyle brand spanning apparel, accessories, home, and fragrances. Premiumization, direct distribution, and iconic products have built brand equity that can endure across cycles. In H1 2026, the company’s share price rose from US$353.61 to US$401.41, an increase of US$47.80, or 13.52%.
FY2026 revenue was approximately US$8.1 billion, up 15% year over year and 12% at constant exchange rates. Fourth-quarter revenue rose 17% on a reported basis and 12% at constant currency. Reported growth of approximately 9% in North America and 17% in Europe reflected relatively balanced performance across regions and channels.
The company continued to execute its “Next Great Chapter: Accelerate” strategy, using core products, higher average unit retail, high-value clients, and elevated store experiences to drive growth. Strong pricing and inventory discipline have allowed the brand to balance revenue, earnings, and cash returns despite polarized consumer demand.
The H2 2026 outlook for Ralph Lauren will be shaped by demanding comparatives, currency movements, and macroeconomic volatility. If brand momentum and full-price sales remain firm, margin and cash flow should continue to underpin the valuation. The quality of growth will matter more than simple store expansion.
[For more insights, please download the full report]

ULTRA LUXE CONSTITUENT ZOOM-IN
Scarcity, Customization, and Long-Dated
Orders Preserve Pricing Power
and Revenue Visibility
The Ultra Luxe Index comprises 11 companies.
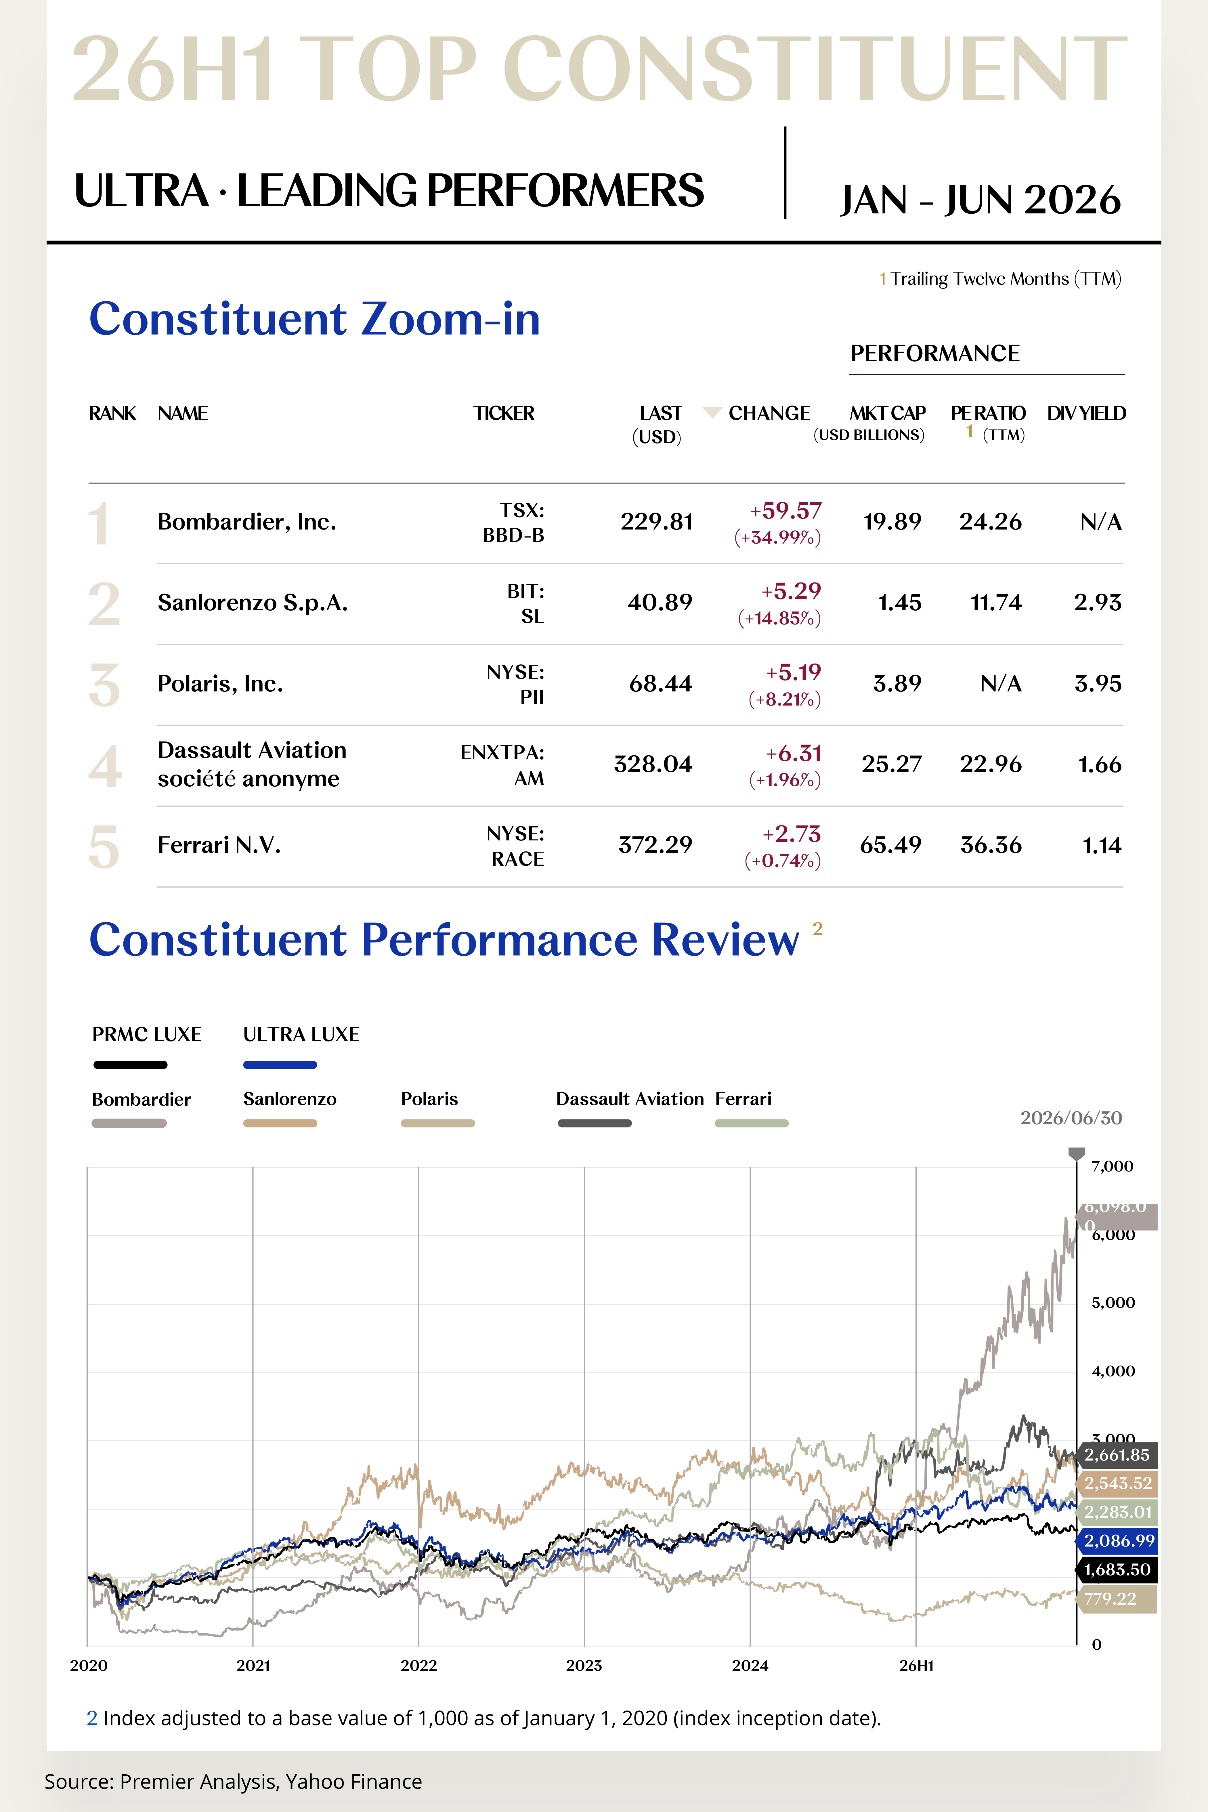
Leading Performers
1. Bombardier Inc. (TSX: BBD-B)
Bombardier is a global leader in business aviation, with the Challenger and Global aircraft families supported by an expanding network for maintenance, parts, and services. The Group provides corporate and high-net-worth clients with full-lifecycle aviation solutions. In H1 2026, the company’s share price rose from US$170.24 to US$229.81, an increase of US$59.57, or 34.99%.
First-quarter 2026 revenue was approximately US$1.6 billion, with 24 business jets delivered, while backlog increased to US$20.3 billion. Services revenue grew approximately 25% year over year to US$617 million, and the larger aftermarket contribution improved the stability of earnings and cash flow through the lower end of the cycle.
The company continued to prepare capacity for premium aircraft including the Global 8000 and expanded its global service-center network. Combining manufacturing with aftermarket services reduces dependence on new-aircraft deliveries while strengthening customer retention and lifetime economics per aircraft.
The H2 2026 valuation case will turn on the delivery ramp, supply-chain stability, and free cash flow. If backlog converts on schedule and services profits continue to expand, Bombardier should be able to reduce leverage further and evolve from a recovery-oriented aerospace stock into a premium industrial business valued for more durable earnings and cash flow.
2. Sanlorenzo S.p.A. (BIT: SL)
Sanlorenzo is an Italian luxury-yacht manufacturer spanning yachts, superyachts, and the Bluegame brand. Bespoke design, scarce capacity, and direct relationships with high-net-worth clients underpin its competitive position. In H1 2026, the company’s share price rose from US$35.60 to US$40.89, an increase of US$5.29, or 14.85%.
First-quarter 2026 revenue increased approximately 4% year over year, EBITDA rose around 4%, and net profit advanced 5.1%, while order intake grew 25.4%. Backlog exceeded EUR 1.0 billion, with roughly 90% originating directly from end clients, providing strong revenue visibility and a high-quality order book.
The company released its 2026-2028 plan, targeting yacht net revenue of EUR 980 million to EUR 1.02 billion in 2026, with technology innovation, product upgrades, and Bluegame expansion identified as the principal sources of growth. Customization and direct client relationships help preserve pricing and delivery discipline.
The H2 2026 outlook will turn on backlog conversion, production execution, and capital-expenditure discipline. Ultra-high-net-worth demand remains resilient, but supply chains and project cycles are lengthy. If margins hold and earnings convert into cash, Sanlorenzo would further validate the scarcity value of a focused, high-end manufacturer.
[For more insights, please download the full report]
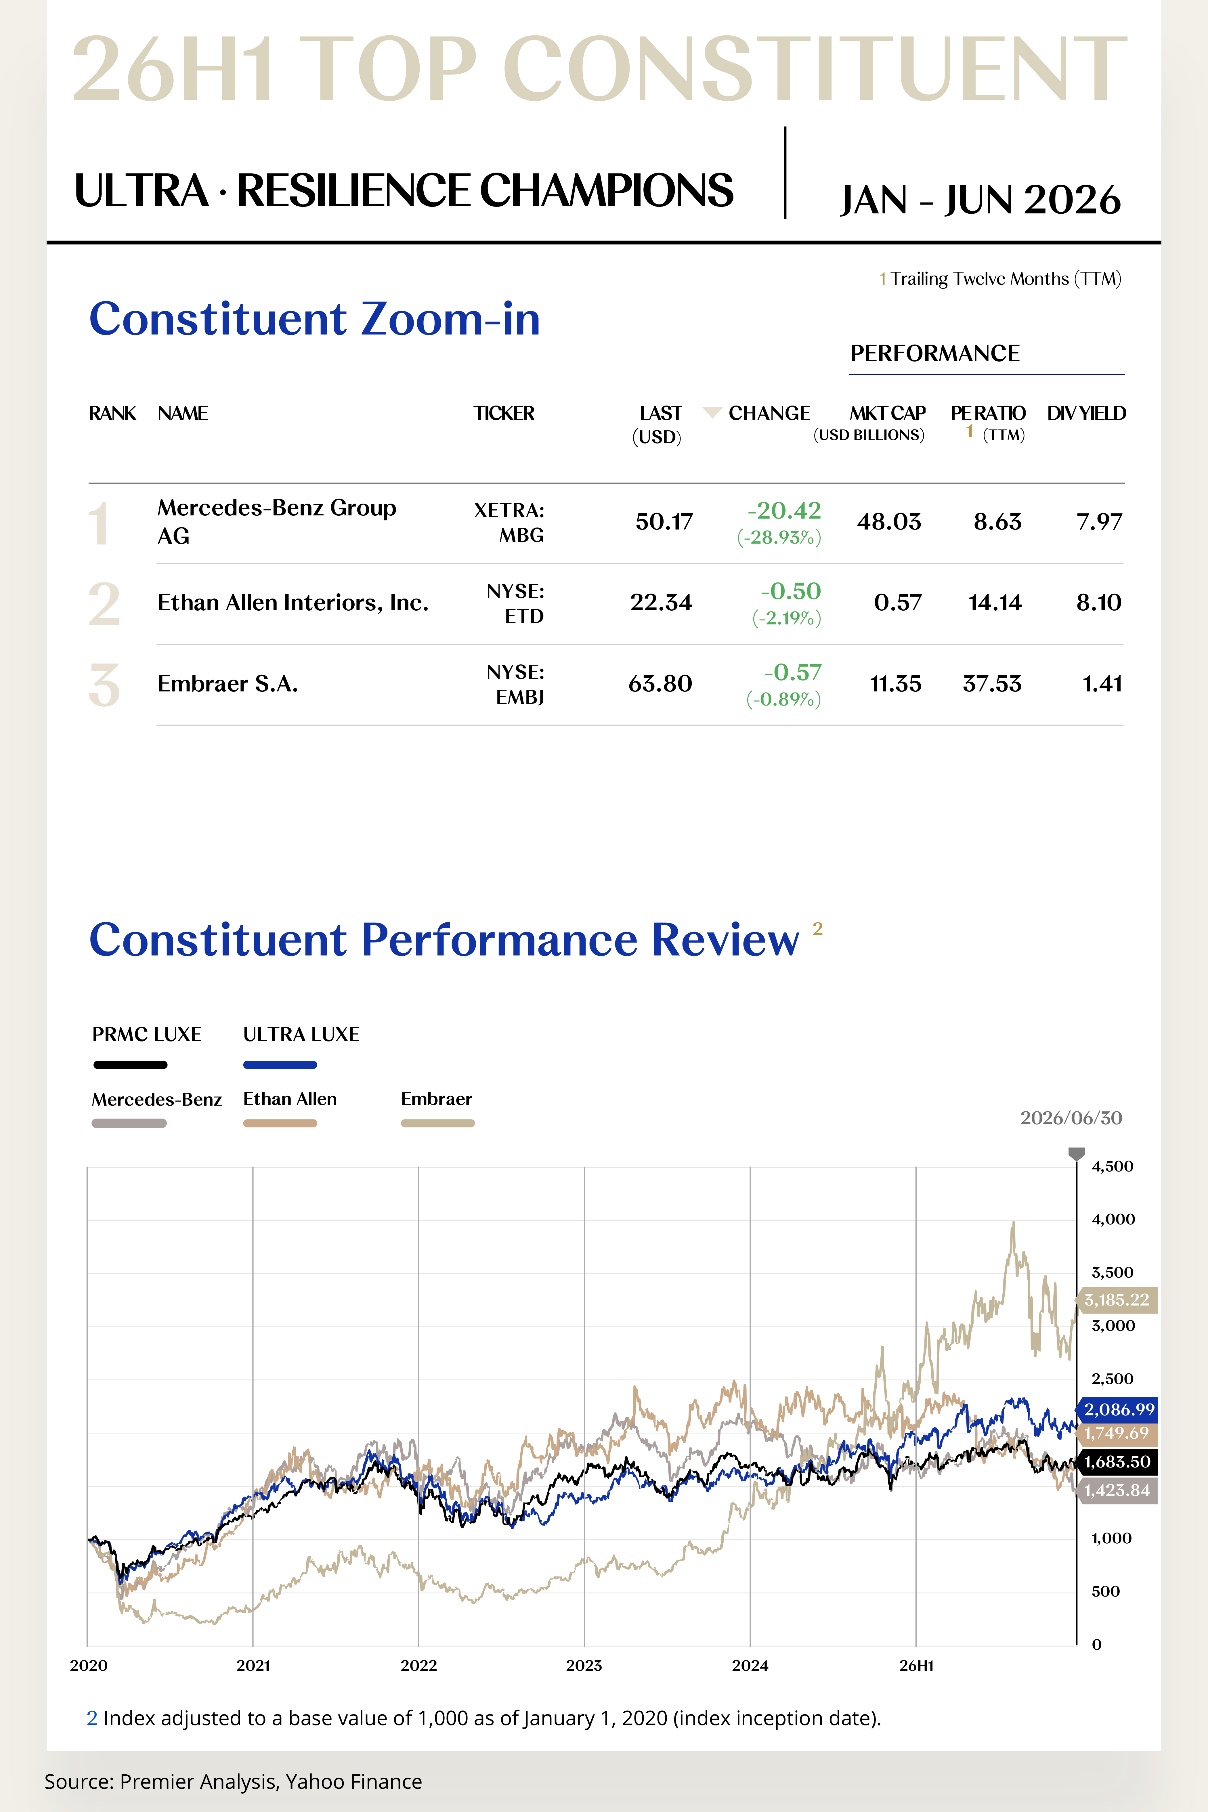
Resilience Champions
1. Mercedes-Benz Group AG (XETRA: MBG)
Mercedes-Benz Group is a global leader in luxury automobiles, spanning Mercedes-Benz Cars, Vans, and financial services. Brand pricing, a global manufacturing footprint, and a broad premium-product portfolio underpin its scale advantages. In H1 2026, the company’s share price fell from US$70.59 to US$50.17, a decline of US$20.42, or 28.93%.
First-quarter 2026 Group revenue was approximately EUR 31.6 billion, down 4.9% year over year, while EBIT declined 16.8%. The adjusted return on sales for Vans remained 10.1%, but passenger-car volumes, tariffs, and product transitions weighed on Group earnings.
The company is advancing an S-Class refresh, the MB.OS software architecture, and a product cycle spanning multiple powertrains, while accelerating regional production and cost initiatives. Its strategy has shifted from a single-track electrification path toward a more flexible combination of combustion, hybrid, and battery-electric vehicles to protect premium-client coverage and plant utilization.
In H2 2026, a valuation recovery will depend on conversion from new models, tariff management, and performance in China. If the product cycle stabilizes average selling prices and volumes, margins could recover. Returns on software and electrification investment still require clearer evidence.
2. Ethan Allen Interiors Inc. (NYSE: ETD)
Ethan Allen Interiors is an integrated U.S. premium home-furnishings company spanning design, manufacturing, and retail. North American production, interior-design services, and directly operated design centers distinguish its operating model. In H1 2026, the company’s share price fell from US$22.84 to US$22.34, a decline of US$0.50, or 2.19%.
Third-quarter FY2026 net sales were US$135.8 million, with a gross margin of 59.4%. Adjusted operating income was US$6.8 million and adjusted EPS was US$0.24. Retail written orders were broadly flat, while wholesale orders declined 7.6%; the high gross margin partly offset soft demand.
The company continued to use local manufacturing, custom design services, and inventory discipline to protect its premium positioning while managing stores and digital channels conservatively. A strong balance sheet and capacity for cash returns provide resilience through a weak home-furnishings cycle.
The central issue for H2 2026 is order stabilization and absorption of fixed costs. If housing activity and premium home demand recover, the vertically integrated manufacturing base could generate meaningful operating leverage. Otherwise, Ethan Allen will need to rely on gross-margin discipline and capital allocation to preserve earnings through the downturn.
[For more insights, please download the full report]
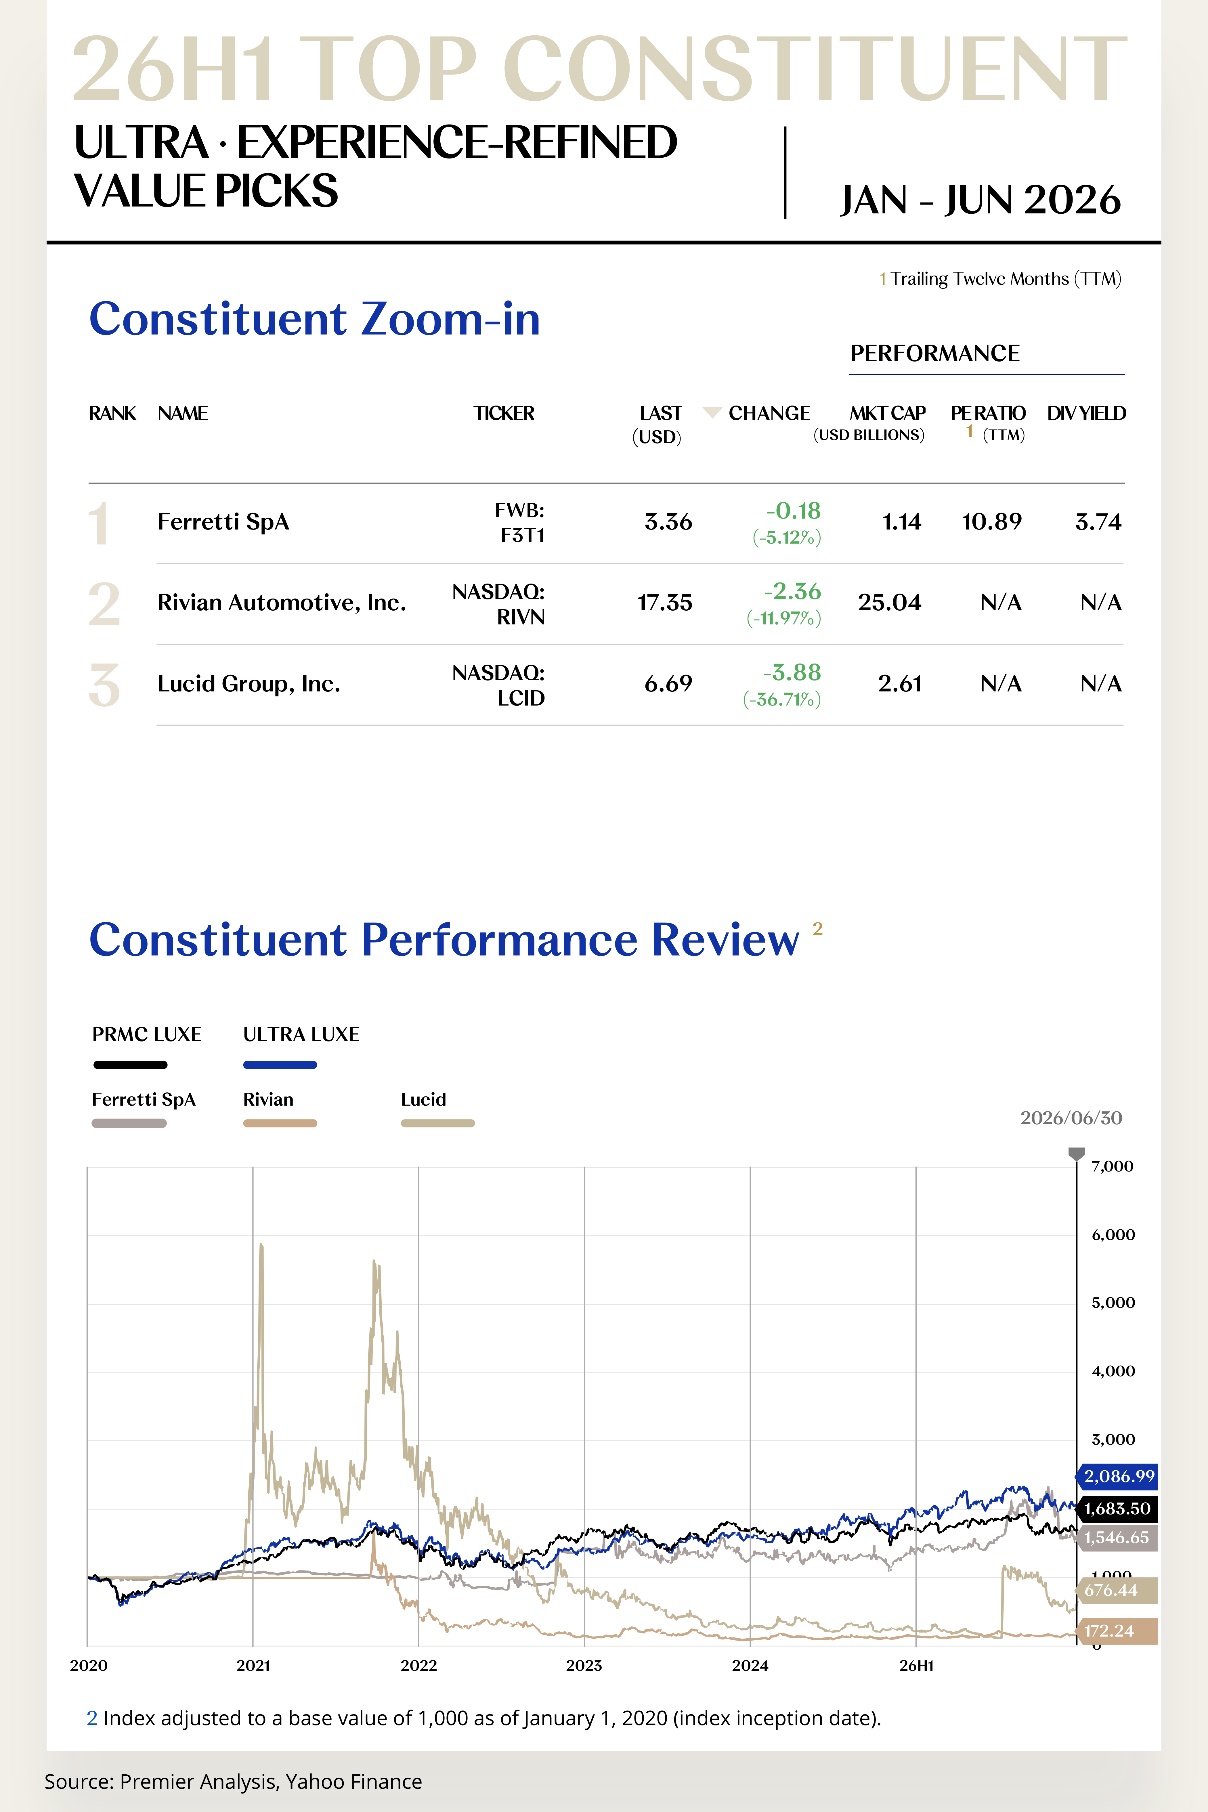
Experience-refined Value Picks
1. Ferretti S.p.A. (FWB: F3T1)
Ferretti is a global luxury-yacht group whose brands include Riva, Pershing, and Ferretti Yachts, covering premium yachts across a range of sizes and design profiles. In H1 2026, the company’s share price fell from US$3.54 to US$3.36, a decline of US$0.18, or 5.12%.
First-quarter 2026 revenue was approximately EUR 302 million, down around 8% year over year. The adjusted EBITDA margin was 16.1%, up roughly 10 basis points, and net profit was approximately EUR 21 million. Stable margins despite lower revenue indicate that pricing and cost control remained effective.
The company continued to advance new models, upgrade capacity, and expand coverage in Asia-Pacific and the Middle East, while using a multi-brand portfolio to serve a broader range of client preferences. The highly customized nature of orders supports revenue visibility, although delivery timing remains sensitive to supply chains and project milestones.
The priorities for Ferretti in H2 2026 are replenishing the order book, delivering yachts, and converting earnings into cash. If new products and regional expansion restore revenue growth, stable margins should amplify profit recovery. Otherwise, fixed costs and inventory requirements may constrain returns on capital.
2. Rivian Automotive, Inc. (NASDAQ: RIVN)
Rivian is a U.S. intelligent-electric-vehicle company focused on premium electric pickups, SUVs, and commercial vehicles. It is also extending the value of its platform through software architecture and a technology partnership with Volkswagen Group. In H1 2026, the company’s share price fell from US$19.71 to US$17.35, a decline of US$2.36, or 11.97%.
First-quarter 2026 revenue reached US$1.381 billion, up 11% year over year, and the company generated gross profit of US$119 million. Adjusted EBITDA nevertheless remained negative US$472 million and free cash flow was negative US$1.075 billion, underscoring the continuing gap between progress at the gross-profit level and cash consumption at scale.
During the first half, Rivian introduced the R2 product lineup and advanced a collaboration with Uber covering up to 50,000 autonomous vehicles. It also received capital support from Volkswagen Group and adjusted its U.S. Department of Energy loan arrangements. A more accessible product range and technology partnerships broaden the company’s commercialization options.
The H2 2026 investment case will turn on R2 engineering progress, cost reduction, and the cash runway. If gross profit remains positive through production volatility, the valuation could begin to reflect the value of the platform rather than primarily its financing risk. Otherwise, continuing capital needs will maintain dilution pressure.
[For more insights, please download the full report]

MASS LUXE CONSTITUENT ZOOM-IN
Fragrance and Beauty Outperform as
Multi-Brand Platforms Extend the
Sources of Growth
The Mass Luxe Index comprises 11 companies.
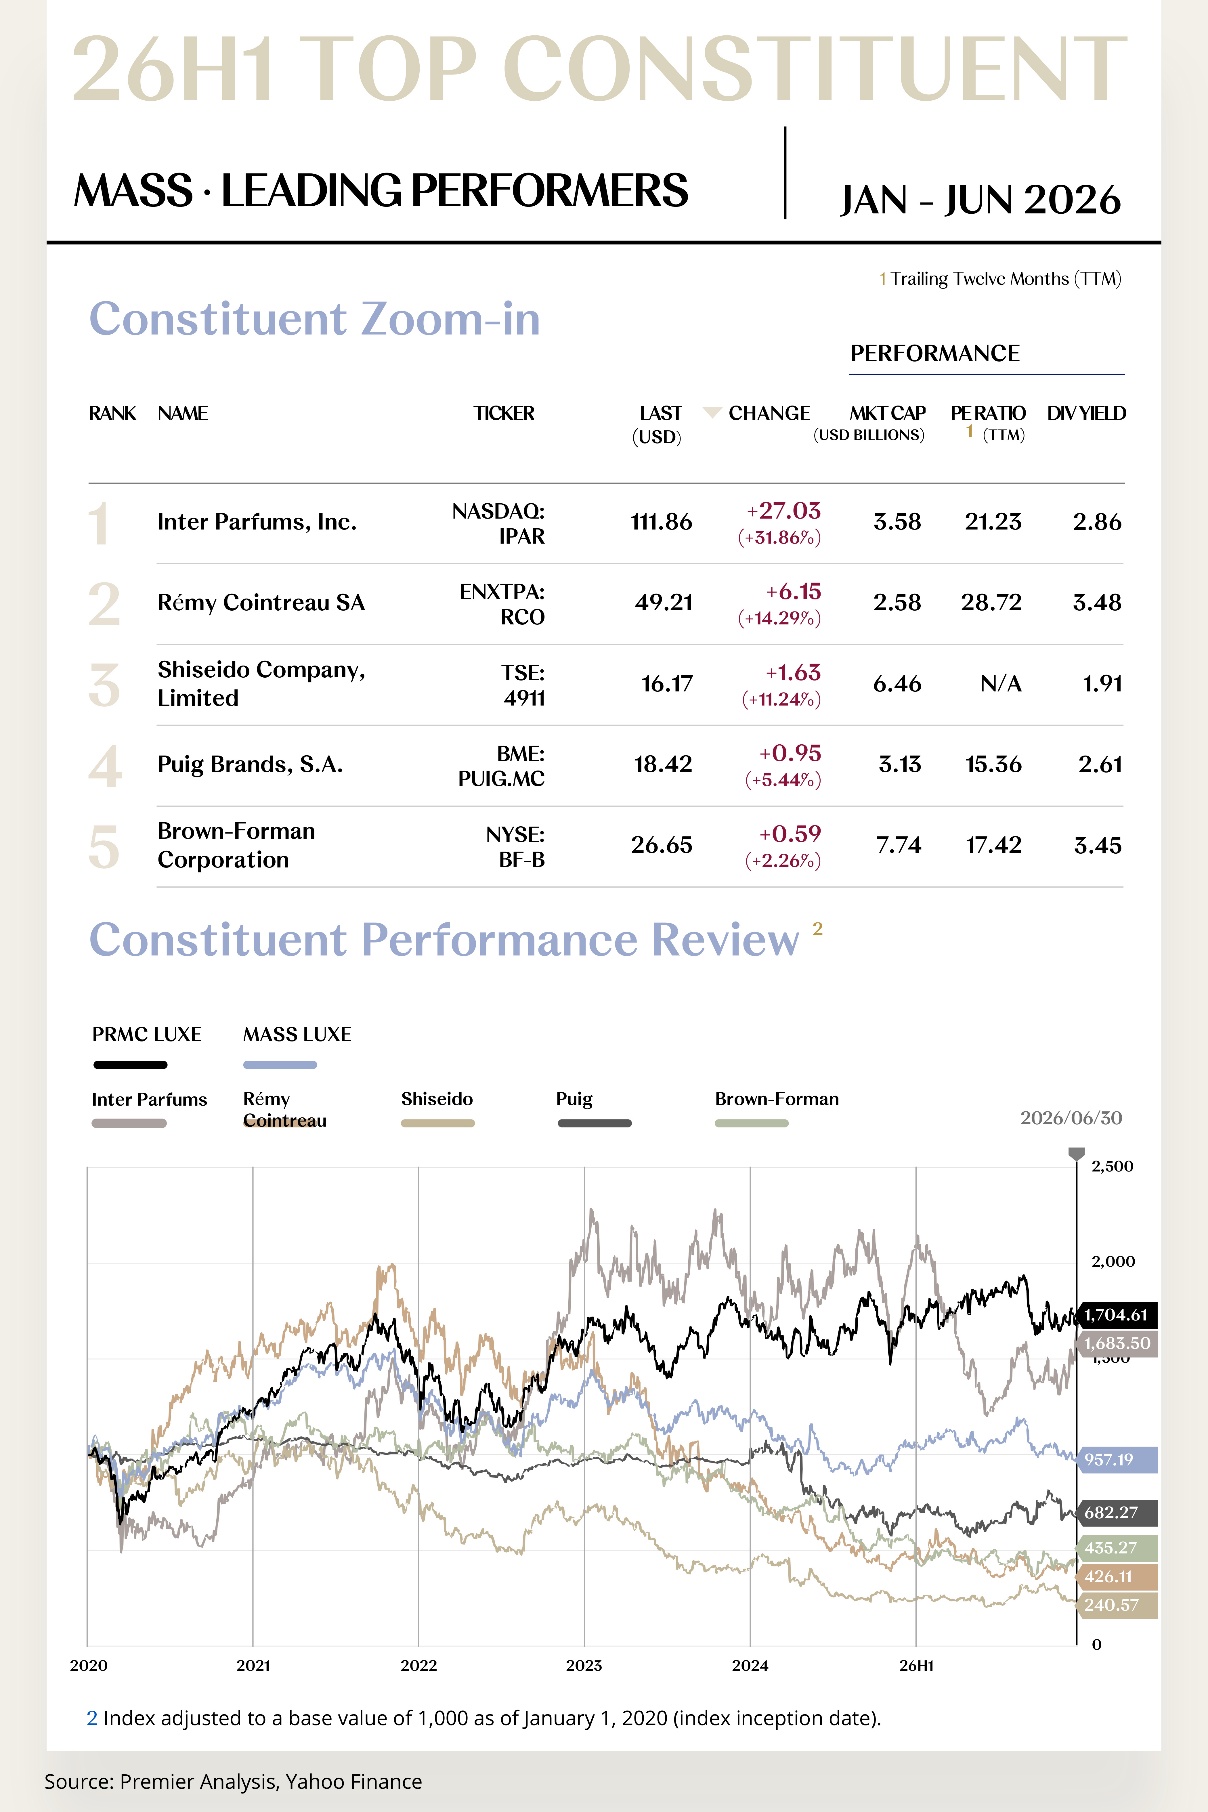
Leading Performers
1. Inter Parfums, Inc. (NASDAQ: IPAR)
Inter Parfums is a global prestige-fragrance licensing and brand-management group that develops and distributes fragrances for Montblanc, Jimmy Choo, Coach, and other brands. Its model combines low capital intensity, global distribution, and long-term licensing partnerships. In H1 2026, the company’s share price rose from US$84.83 to US$111.86, an increase of US$27.03, or 31.86%.
First-quarter 2026 net sales were approximately US$345 million, up 2% year over year, while EPS increased 2% to US$1.35. Gross margin expanded 140 basis points to 65.1%. Against a shifting launch calendar and foreign-exchange headwinds, the margin improvement reflected strong pricing and a favorable product mix.
The company continued to expand its licensing pipeline, launch new products, and strengthen distribution in the United States and Europe. Fragrance combines repeat purchasing, low capital intensity, and brand-extension potential, allowing Inter Parfums to maintain strong cash conversion despite polarization in luxury spending.
For H2 2026, performance will hinge on new launches, license renewals, and channel restocking. If sales growth accelerates while margins hold, Inter Parfums would further validate the durability and cash-generative quality of its focused licensing model. Concentration in individual licenses and fluctuations in retail inventory will remain key risks.
2. Rémy Cointreau SA (ENXTPA: RCO)
Rémy Cointreau is a French premium-spirits group centered on Rémy Martin, Louis XIII, Cointreau, and Bruichladdich, with a particularly high exposure to prestige cognac and specialist spirits. In H1 2026, the company’s share price rose from US$43.05 to US$49.21, an increase of US$6.15, or 14.29%.
FY2025/26 sales were EUR 935.3 million, up 0.2% organically but down 5% on a reported basis. Current operating profit was EUR 165.4 million, down 11.5% organically. Revenue stabilized, but profitability remained under pressure from channel adjustments in China and the United States and from fixed costs.
The company launched the “RC Forward” transformation program, setting growth and cost-reduction targets across organizational simplification, brand-investment productivity, travel retail, and emerging markets, with the aim of materially improving operating profit over three years. The strategic emphasis has shifted from waiting for the cycle to recover toward actively reshaping the cost base and market footprint.
For H2 2026, performance will hinge on normalization of U.S. inventory, premium demand in China, and delivery of transformation savings. If stable sales combine with a lower expense base, earnings should improve faster than revenue. Trade and regulatory risks remain significant.
[For more insights, please download the full report]
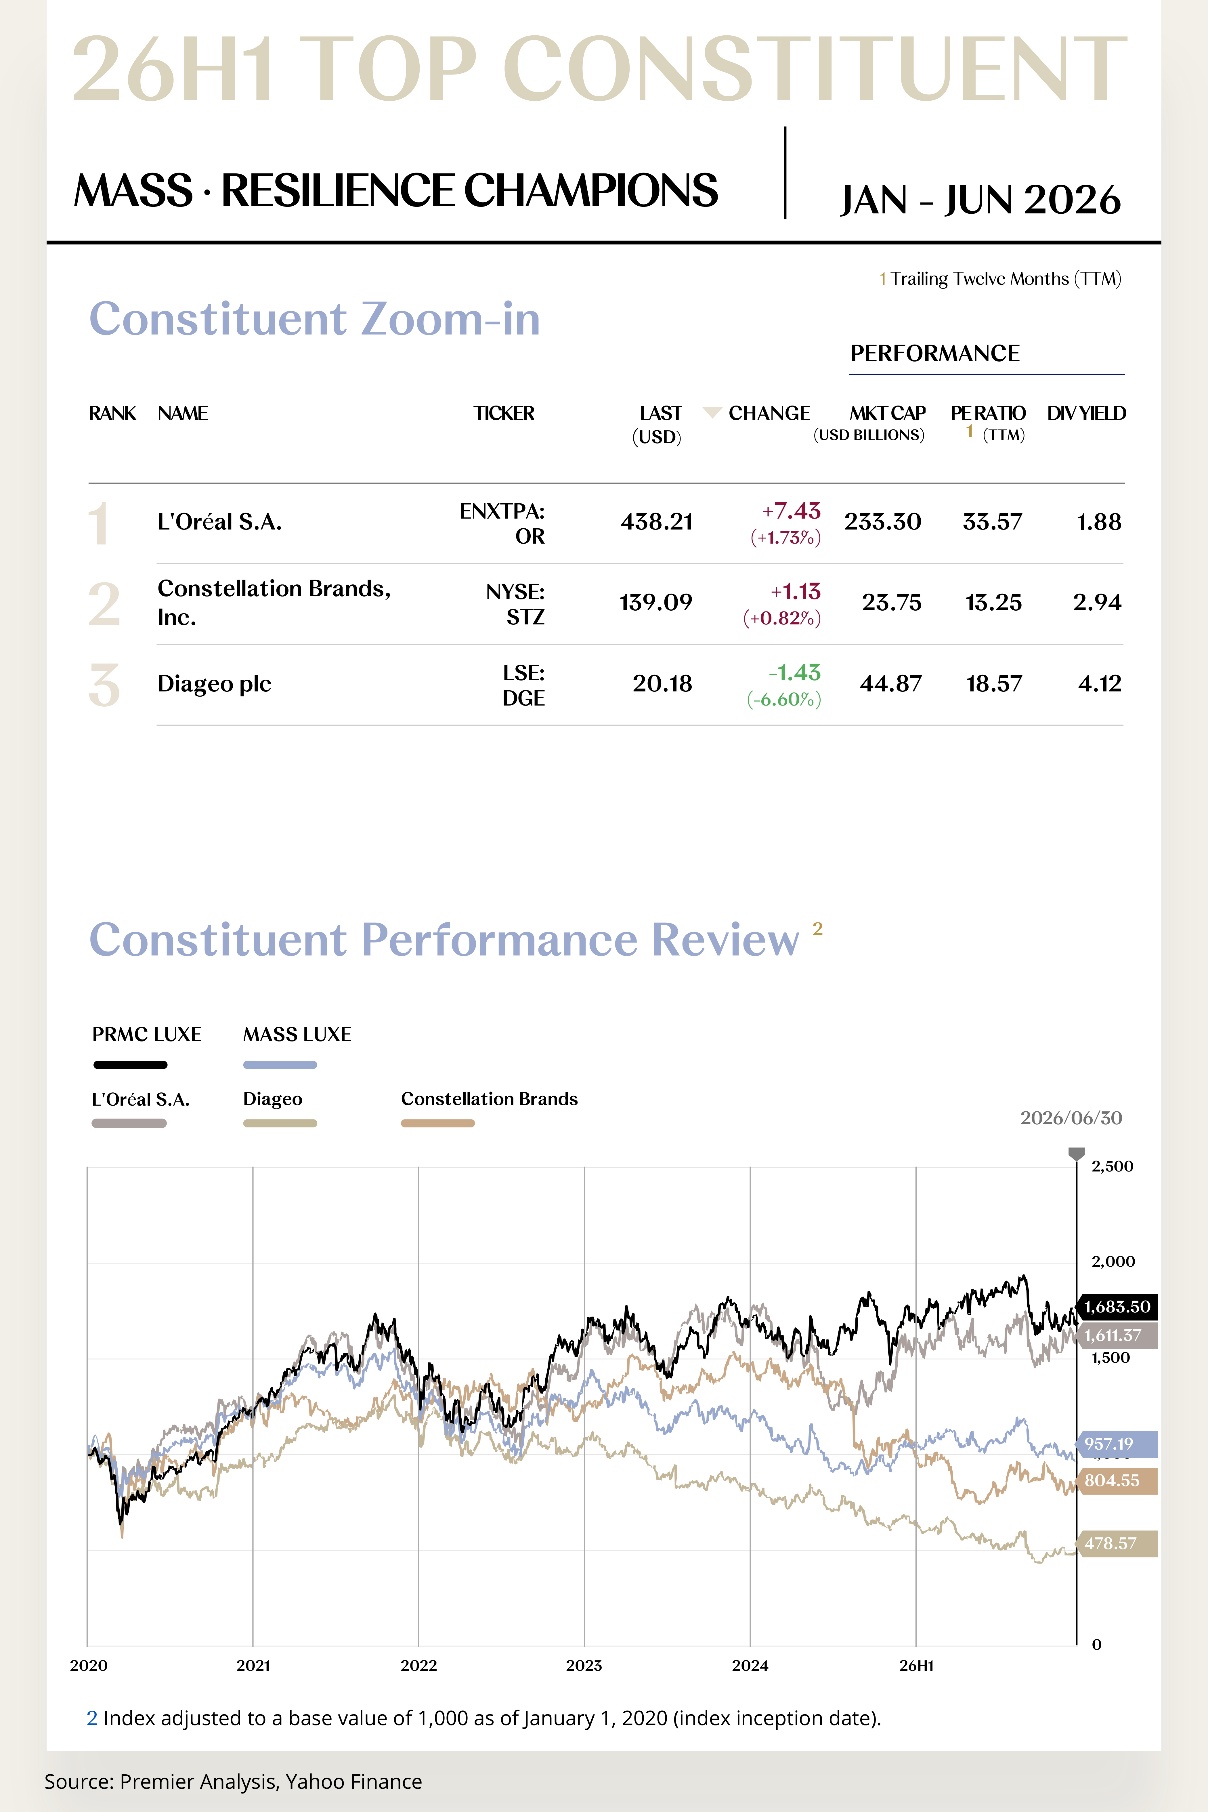
Resilience Champions
1. L’Oréal S.A. (ENXTPA: OR)
L’Oréal is the world’s largest beauty group, spanning Consumer Products, Luxe, Professional Products, and Dermatological Beauty. Research, portfolio breadth, and global distribution create enduring scale advantages. In H1 2026, the company’s share price rose from US$430.77 to US$438.21, an increase of US$7.43, or 1.73%.
First-quarter 2026 sales were EUR 12.15 billion, up 3.6% year over year and 7.6% on a like-for-like basis. Adjusted like-for-like growth was 6.7%, with all divisions and regions expanding. The multi-category, multi-region model effectively diversified exposure to individual market swings.
The Group continued to strengthen prestige fragrance, Dermatological Beauty, digital marketing, and acquisition integration while using research and data capabilities to improve new-product success rates. Portfolio breadth supports scale, while specialist expertise continues to raise the contribution from higher-margin businesses.
The priority for H2 2026 is to convert strong like-for-like growth into earnings and cash flow while managing currency movements and integration costs. If Luxe and Dermatological Beauty retain their leadership, L’Oréal should continue to justify its valuation through consistent execution.
2. Constellation Brands, Inc. (NYSE: STZ)
Constellation Brands is a North American premium beer, wine, and spirits group. Imported beer brands including Modelo and Corona generate the majority of profit and benefit from strong distribution, consumer recognition, and pricing power. In H1 2026, the company’s share price rose from US$137.96 to US$139.09, an increase of US$1.13, or 0.82%.
FY2026 net sales were approximately US$9.139 billion, down 10% year over year. Comparable operating income was approximately US$2.943 billion, comparable net income was US$2.075 billion, and EPS was US$11.82. Fourth-quarter sales declined 11% to US$1.920 billion as demand and portfolio adjustments weighed on performance.
The company continued to concentrate capital on its core beer business and improve capital efficiency through portfolio optimization, capacity investment, and more than US$1.6 billion of shareholder returns. Brand strength remains intact, but the near-term task is to rebalance price, volume, and consumer affordability.
For H2 2026, performance will hinge on spending among U.S. Hispanic consumers, beer volumes, and inventory normalization. If core brands return to growth, earnings and cash flow should respond strongly. High capital expenditure and category concentration require careful management.
[For more insights, please download the full report]
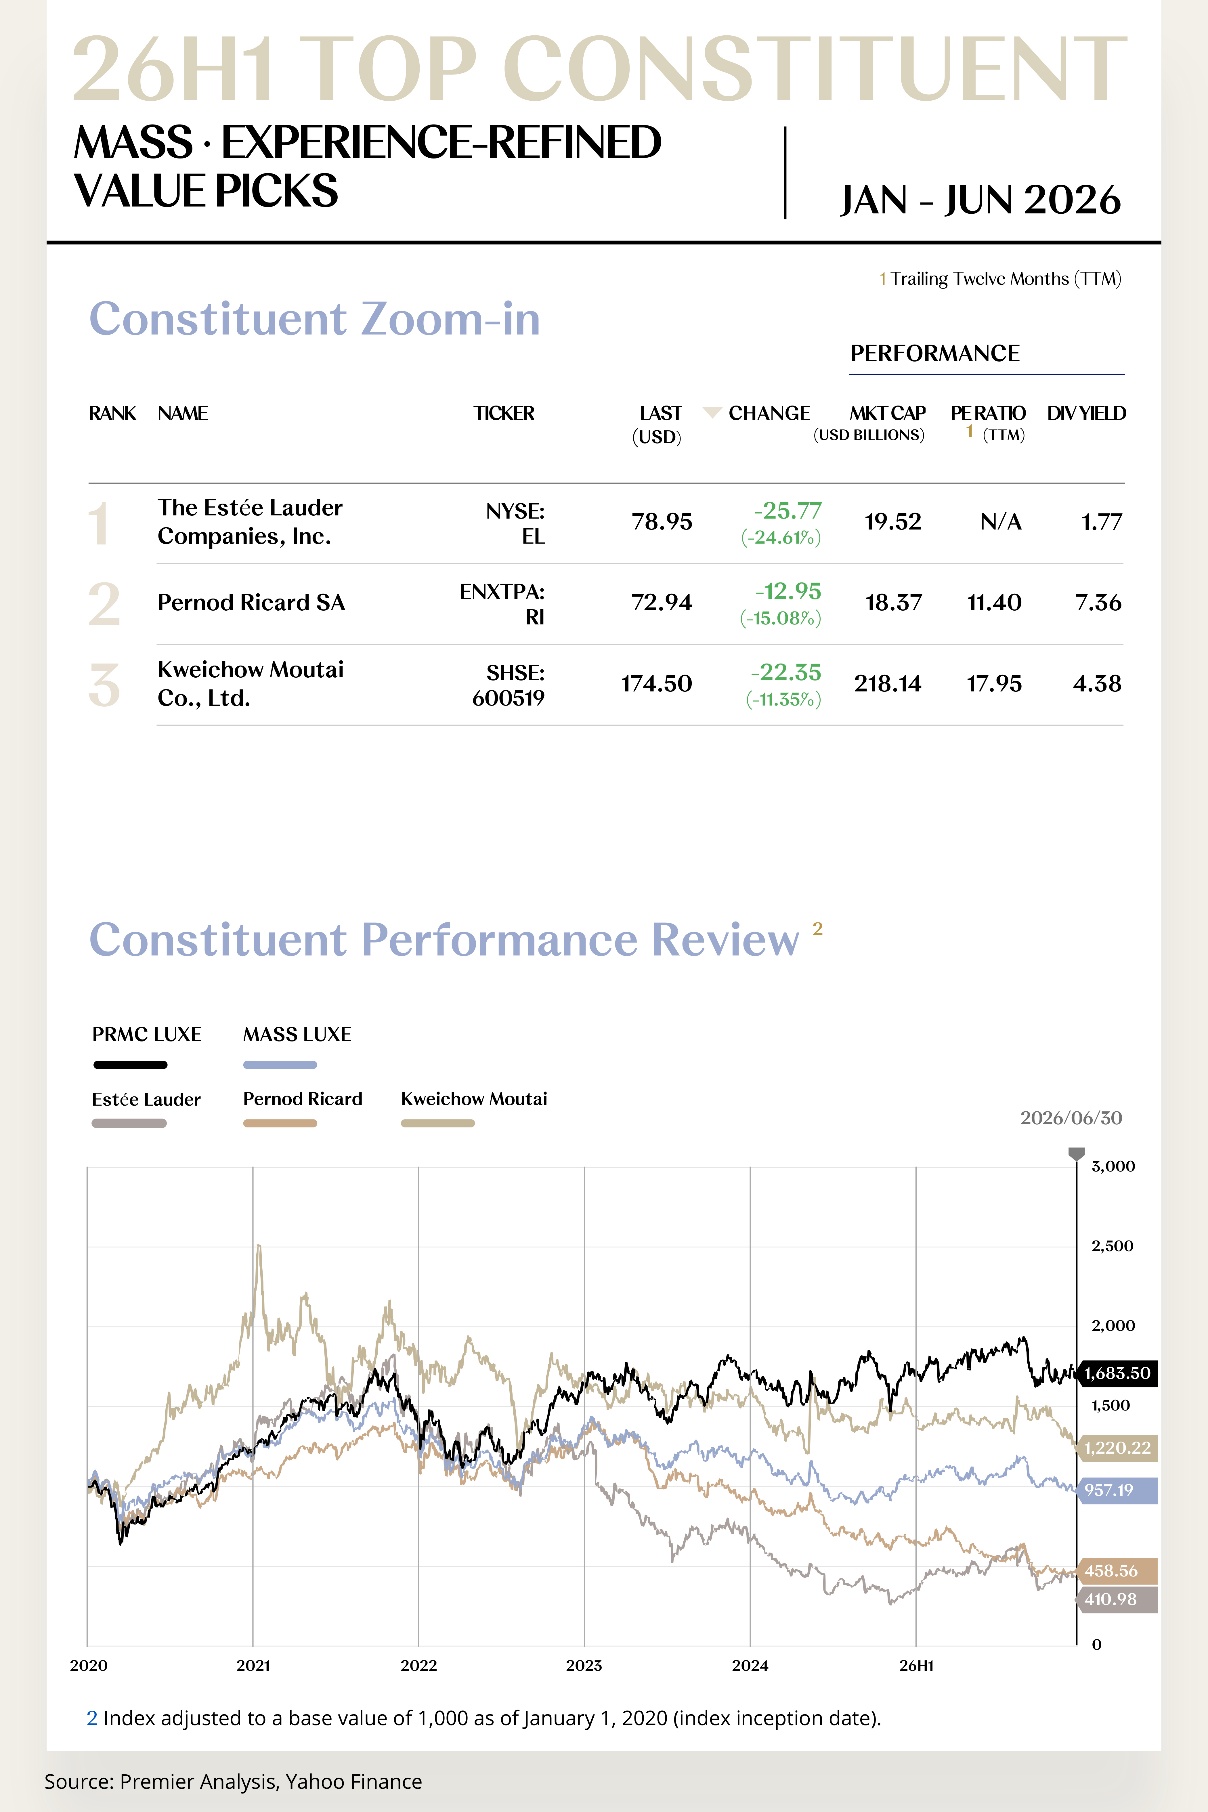
Experience-refined Value Picks
1. The Estée Lauder Companies Inc. (NYSE: EL)
The Estée Lauder Companies is a global prestige-beauty group whose brands include Estée Lauder, La Mer, M·A·C, and Jo Malone London. It has deep channel positions in department stores, travel retail, and premium skincare. In H1 2026, the company’s share price fell from US$104.72 to US$78.95, a decline of US$25.77, or 24.61%.
Third-quarter FY2026 reported operating margin was 6.7%, compared with 8.6% a year earlier, and included US$127 million of restructuring charges and a US$84 million legal contingency. The company nevertheless raised its full-year outlook, forecasting organic sales growth of close to 3% and an adjusted operating margin of 10.7% to 11.0%.
The “Beauty Reimagined” transformation focuses on organizational simplification, brand innovation, channel inventory, marketing efficiency, and lower capital expenditure. The operating model is moving away from broad distribution toward faster product development, priority markets, and stricter return thresholds.
The principal source of upside in H2 2026 is margin recovery rather than a simple rebound in revenue. If travel retail and China stabilize and restructuring savings are delivered, the valuation could recover. Brand momentum and execution complexity will remain the principal uncertainties.
2. Pernod Ricard S.A. (ENXTPA: RI)
Pernod Ricard is the world’s second-largest international spirits group, with brands including Martell, Chivas Regal, Jameson, and Absolut. Its global distribution network and diversified category portfolio underpin its competitive advantage. In H1 2026, the company’s share price fell from US$85.90 to US$72.94, a decline of US$12.95, or 15.08%.
First-half FY2026 organic sales declined 5.9% year over year and reported sales fell 14.9%, while organic profit from recurring operations decreased 7.5%. Weakness in China, the United States, and travel retail, compounded by currency movements, left both revenue and earnings in a period of adjustment.
The company is reallocating resources across brands and functions, using scaled cost reductions, inventory normalization, and a sharper focus on core markets to improve cash efficiency. The objective is to preserve long-term brand investment while removing low-return complexity that could erode asset quality during the downturn.
The H2 2026 outlook will turn on Chinese channel inventory, U.S. demand, and execution of the efficiency plan. If the rate of sales decline narrows and cash flow stabilizes, the depressed valuation may offer recovery potential. Trade policy, currency movements, and premium-spirits demand remain the principal risks.
[For more insights, please download the full report]

EXPERIENTIAL LUXE CONSTITUENT ZOOM-IN
Premium Travel Recovers as
Experience-Led Models Improve the
Earnings Power of Hospitality Assets
The Experiential Luxe Index comprises 12 companies.
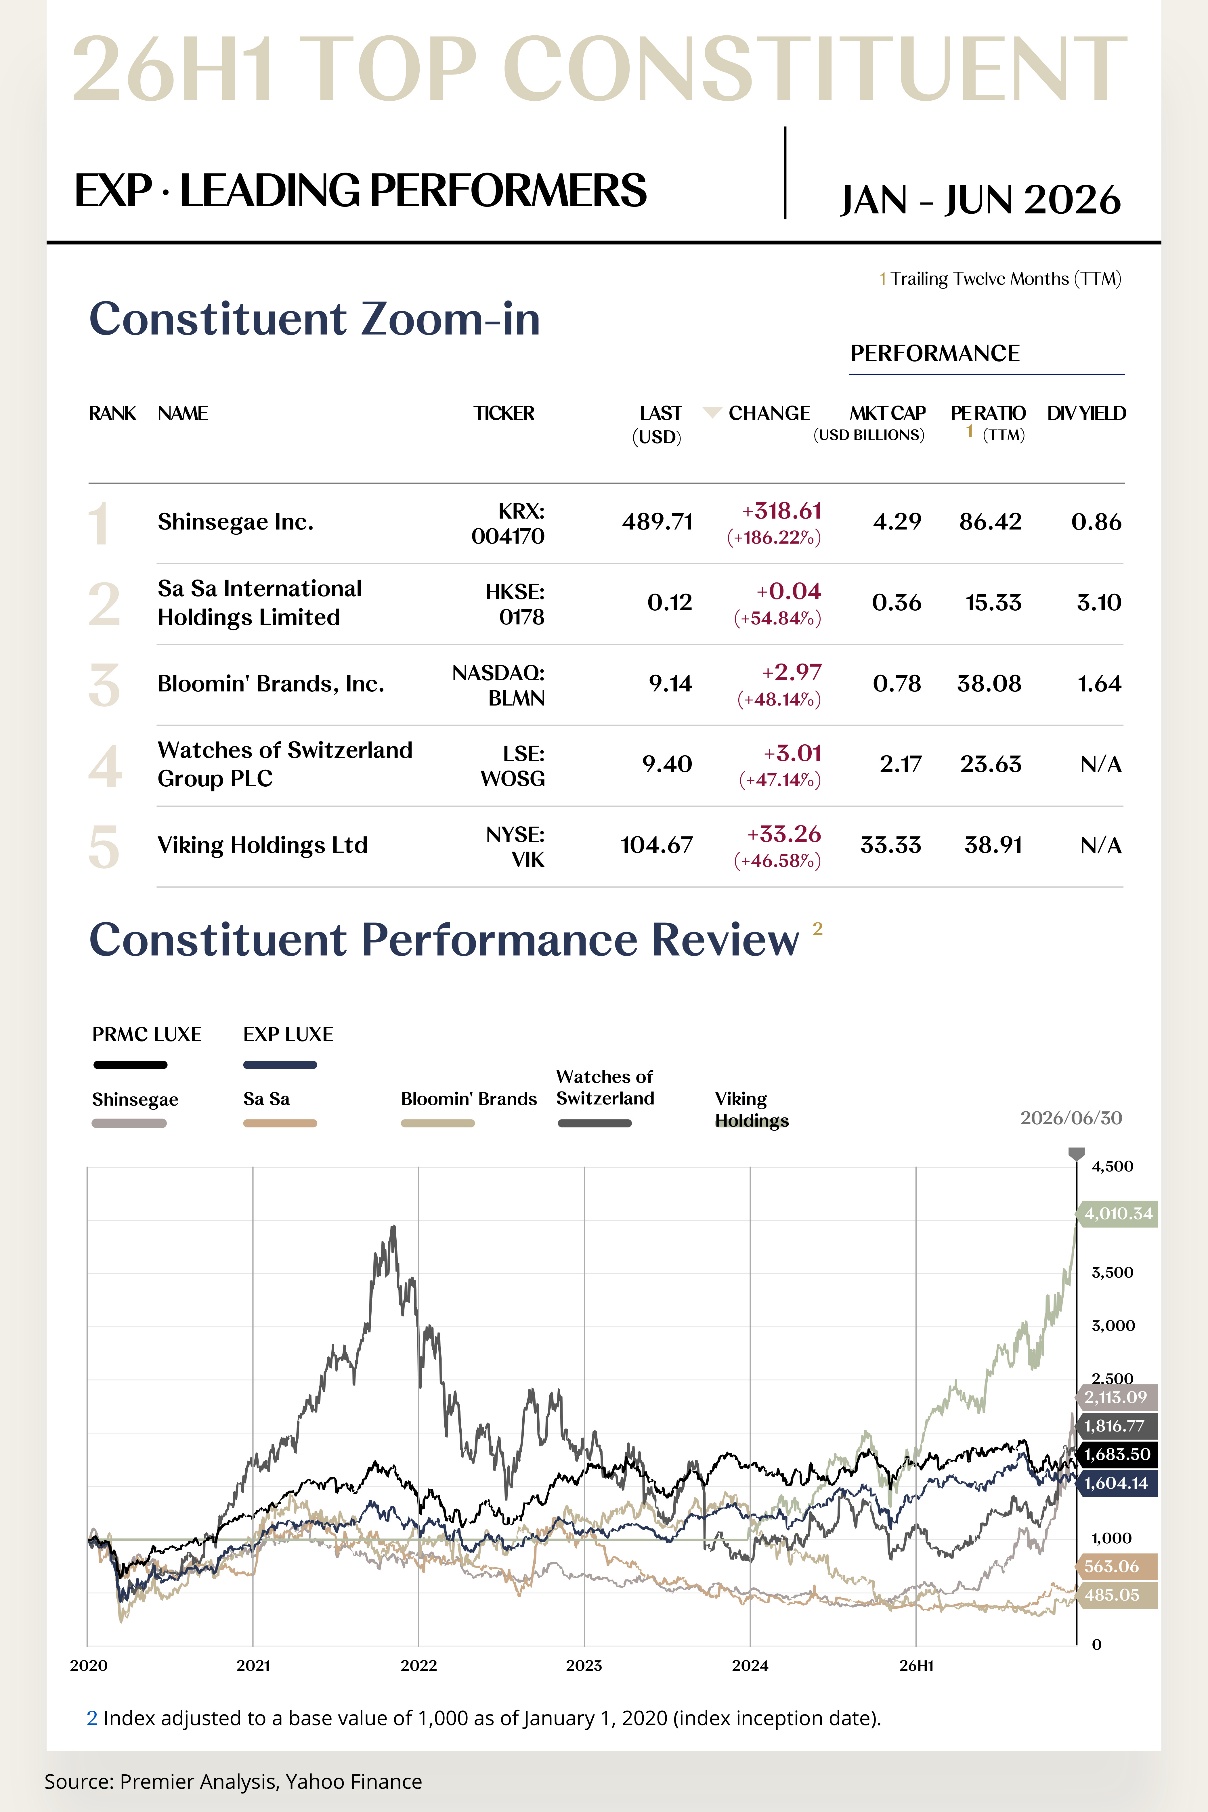
Leading Performers
1. Shinsegae Inc. (KRX: 004170)
Shinsegae is a Korean premium-retail and consumer group spanning department stores, duty-free, fashion, and lifestyle. Its assets in core commercial districts and high-end brand portfolio connect affluent domestic demand with inbound tourism spending. In H1 2026, the company’s share price rose from US$171.10 to US$489.71, an increase of US$318.61, or 186.22%.
First-quarter 2026 consolidated sales were approximately KRW 1.84 trillion, up 10.9% year over year. Operating profit increased 49.5% to KRW 197.8 billion and net profit rose 88.5% to KRW 145.4 billion, representing a strong quarterly earnings performance.
Growth was driven mainly by premium department-store spending, productivity at core stores, and improvement in subsidiaries. Shinsegae continued to raise sales per square meter through flagship department stores, membership operations, a curated luxury-brand portfolio, and closer coordination with travel retail, reinforcing its role as a central platform for premium consumption in Korea.
The durability of the recovery in H2 2026 will depend on the Korean wealth effect, inbound tourism, and recovery in duty-free. If premium consumption remains resilient and drives further profit improvement at subsidiaries, the Group could move from an asset-discount valuation toward one that better reflects its operating quality.
2. Sa Sa International Holdings Limited (HKSE: 0178)
Sa Sa International is an Asian beauty retailer focused on Hong Kong, Macau, and Southeast Asia. Its operating model is built on multi-brand curation, a physical store network, and spending by inbound visitors. In H1 2026, the company’s share price rose from US$0.08 to US$0.12, an increase of US$0.04, or 54.84%.
FY2025/26 Group profit increased 160.5% year over year. In the fourth quarter ended March 2026, offline like-for-like sales in Hong Kong and Macau rose 37.2%, and total turnover increased 30.9%, reflecting a significant recovery in traffic and store productivity.
The company continued to optimize its store portfolio, merchandise procurement, and digital membership operations, concentrating resources on higher-return markets in Hong Kong, Macau, and Southeast Asia. Recovering travel consumption and better inventory turnover have created substantial earnings leverage for a relatively small retail platform.
The H2 2026 outlook will turn on inbound traffic, like-for-like growth, and gross margin. If the travel recovery continues and rent and labor productivity remain disciplined, profit can continue to grow faster than revenue. Low-price competition and fragmented channels will continue to test assortment quality and member retention.
[For more insights, please download the full report]
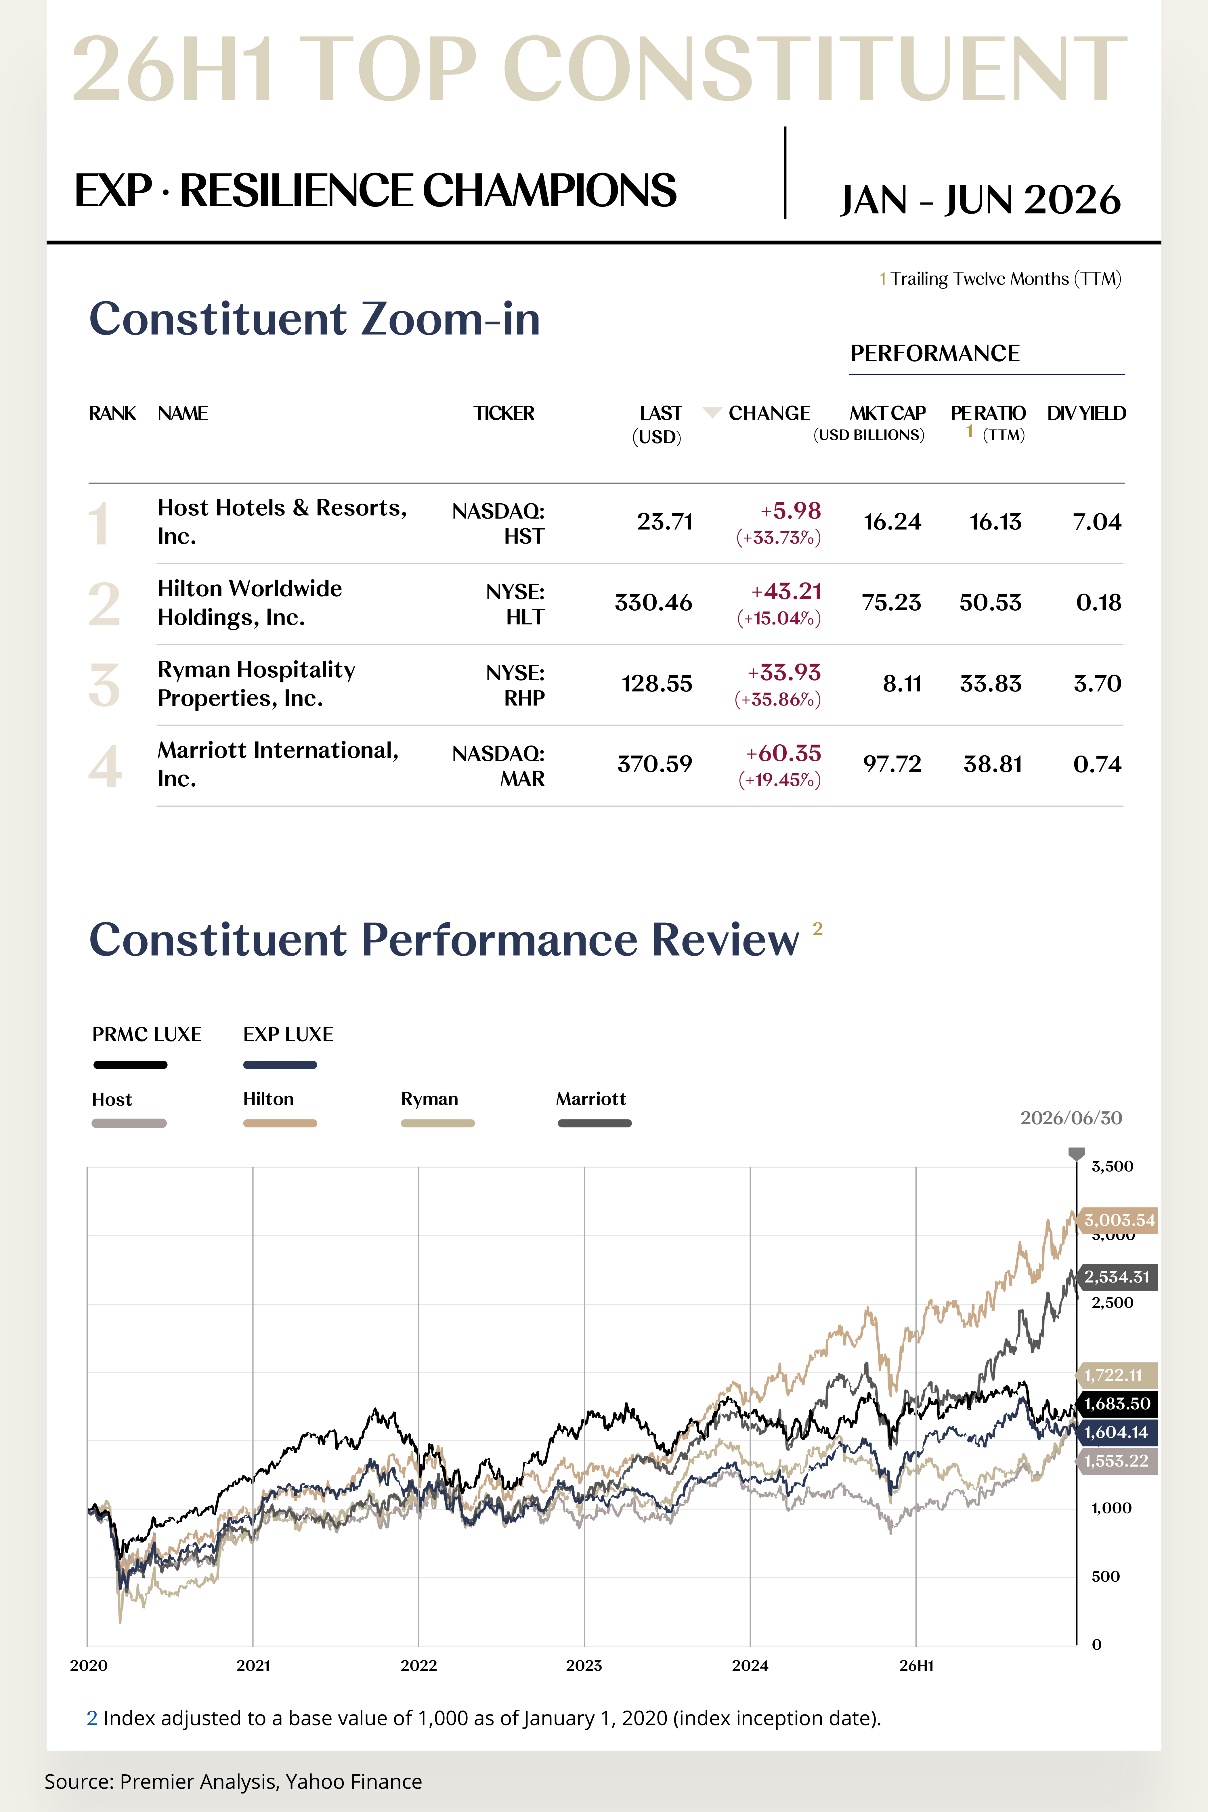
Resilience Champions
1. Host Hotels & Resorts, Inc. (NASDAQ: HST)
Host Hotels & Resorts is one of the largest U.S. lodging real estate investment trusts, with a portfolio of premium and luxury hotels. Attractive destinations, leading brand operators, and active asset management underpin property-level cash generation. In H1 2026, the company’s share price rose from US$17.73 to US$23.71, an increase of US$5.98, or 33.73%.
First-quarter 2026 comparable hotel RevPAR increased 4.4% and total RevPAR rose 4.6%. Comparable hotel EBITDA was US$505 million, up 7% year over year, with margin expanding 70 basis points to 32.7%. Net income nearly doubled to US$501 million, supported by gains on asset sales.
The company continued to improve returns through asset disposals, renovation investment, and optimization of its destination portfolio while maintaining a quarterly dividend of US$0.20 per share. Premium leisure and group demand support both property-level earnings and the value of the underlying assets.
The H2 2026 outlook will turn on room rates, group business, and capital allocation. If premium travel demand holds, renovation projects deliver, and disposal discipline continues, both free cash flow and net asset value have scope to improve.
2. Hilton Worldwide Holdings Inc. (NYSE: HLT)
Hilton is a leading global asset-light hotel group with brands spanning luxury, lifestyle, full-service, and select-service segments. Management and franchise fees, together with the Hilton Honors ecosystem, underpin its growth model. In H1 2026, the company’s share price rose from US$287.25 to US$330.46, an increase of US$43.21, or 15.04%.
First-quarter 2026 system-wide comparable RevPAR increased 3.6% year over year. Net income was US$383 million, adjusted EBITDA reached US$901 million, and adjusted EPS was US$2.01. The operating performance led the company to raise its full-year outlook.
The Group continued to expand its brand portfolio and global development pipeline while using Hilton Honors, co-branded credit cards, and digital direct booking to increase customer lifetime value. Asset-light expansion reduces capital requirements and allows room growth to translate more quickly into fee income and shareholder returns.
The priorities for H2 2026 are net unit growth, RevPAR, and development signings. If travel demand remains stable, the fee-based model should continue to generate high incremental margins. The premium valuation requires sustained pipeline conversion and returns from share repurchases.
[For more insights, please download the full report]
Experience-refined Value Picks
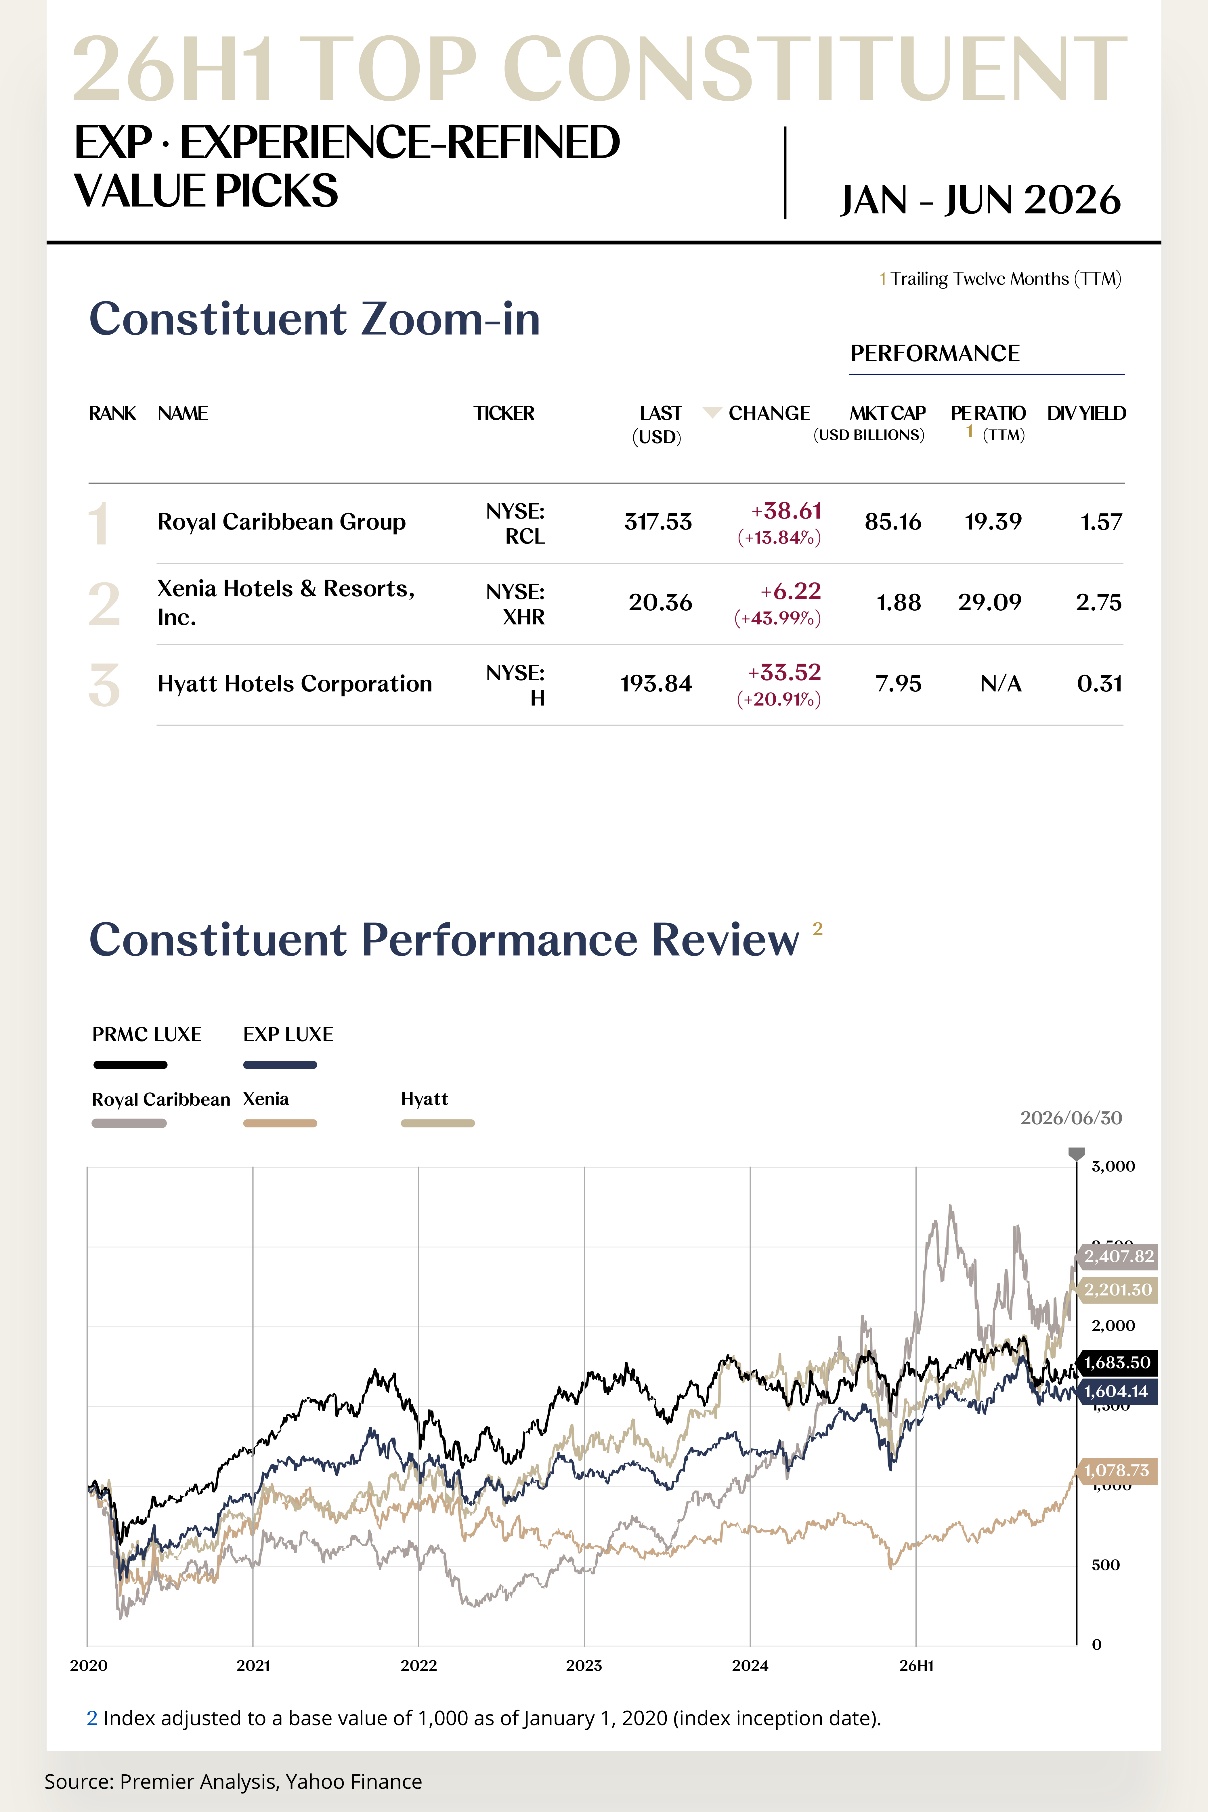
1. Royal Caribbean Group (NYSE: RCL)
Royal Caribbean Group is a global leader in cruise vacations. Royal Caribbean International, Celebrity Cruises, and Silversea span premium mass-market, modern luxury, and ultra-luxury expedition travel. In H1 2026, the company’s share price rose from US$278.92 to US$317.53, an increase of US$38.61, or 13.84%.
First-quarter 2026 revenue was approximately US$4.5 billion and adjusted EBITDA was around US$1.7 billion. Net income was approximately US$900 million, with EPS of US$3.48 and adjusted EPS of US$3.60, all materially above the prior-year period. Strong bookings and onboard spending continued to amplify profit growth.
The company is using new ships, private destinations, digital revenue management, and differentiated brand positioning to raise revenue per available passenger cruise day, while repurchasing shares and improving its debt profile. The distinctiveness of the onboard and destination experience continues to give cruising advantages in both pricing and content relative to land-based vacations.
The H2 2026 upside rests on high booking levels, net yields, and incremental capacity. If consumers maintain travel spending, earnings and cash flow can continue to expand. Geopolitical risk, fuel costs, and high capital investment will remain the principal factors to monitor.
2. Xenia Hotels & Resorts, Inc. (NYSE: XHR)
Xenia Hotels & Resorts is a U.S. luxury and upper-upscale hotel real estate investment trust with assets concentrated in major cities and leisure destinations and operated under brands including Marriott, Hyatt, and Kimpton. In H1 2026, the company’s share price rose from US$14.14 to US$20.36, an increase of US$6.22, or 43.99%.
First-quarter 2026 net income attributable to common shareholders was US$19.8 million, or US$0.21 per share. Adjusted EBITDAre increased 11.6% year over year to US$81.4 million. Demand for premium assets and operating improvements supported growth in cash earnings.
The company continued to improve property returns through renovations of guestrooms and public spaces, portfolio optimization, and disciplined capital allocation. Its smaller scale allows individual refurbishment projects and regional demand improvements to flow through more visibly to consolidated results.
The H2 2026 valuation case will turn on renovation returns, RevPAR, and financing costs. If premium leisure and group demand remain firm, the discount to net asset value could narrow. Geographic concentration and capital-expenditure execution will remain the principal risks.
[For more insights, please download the full report]

MACROECONOMY UPDATES
Structural Reshaping Forging Resilience,
Steady Progress Navigating Market Uncertainty
Global Economy Growth
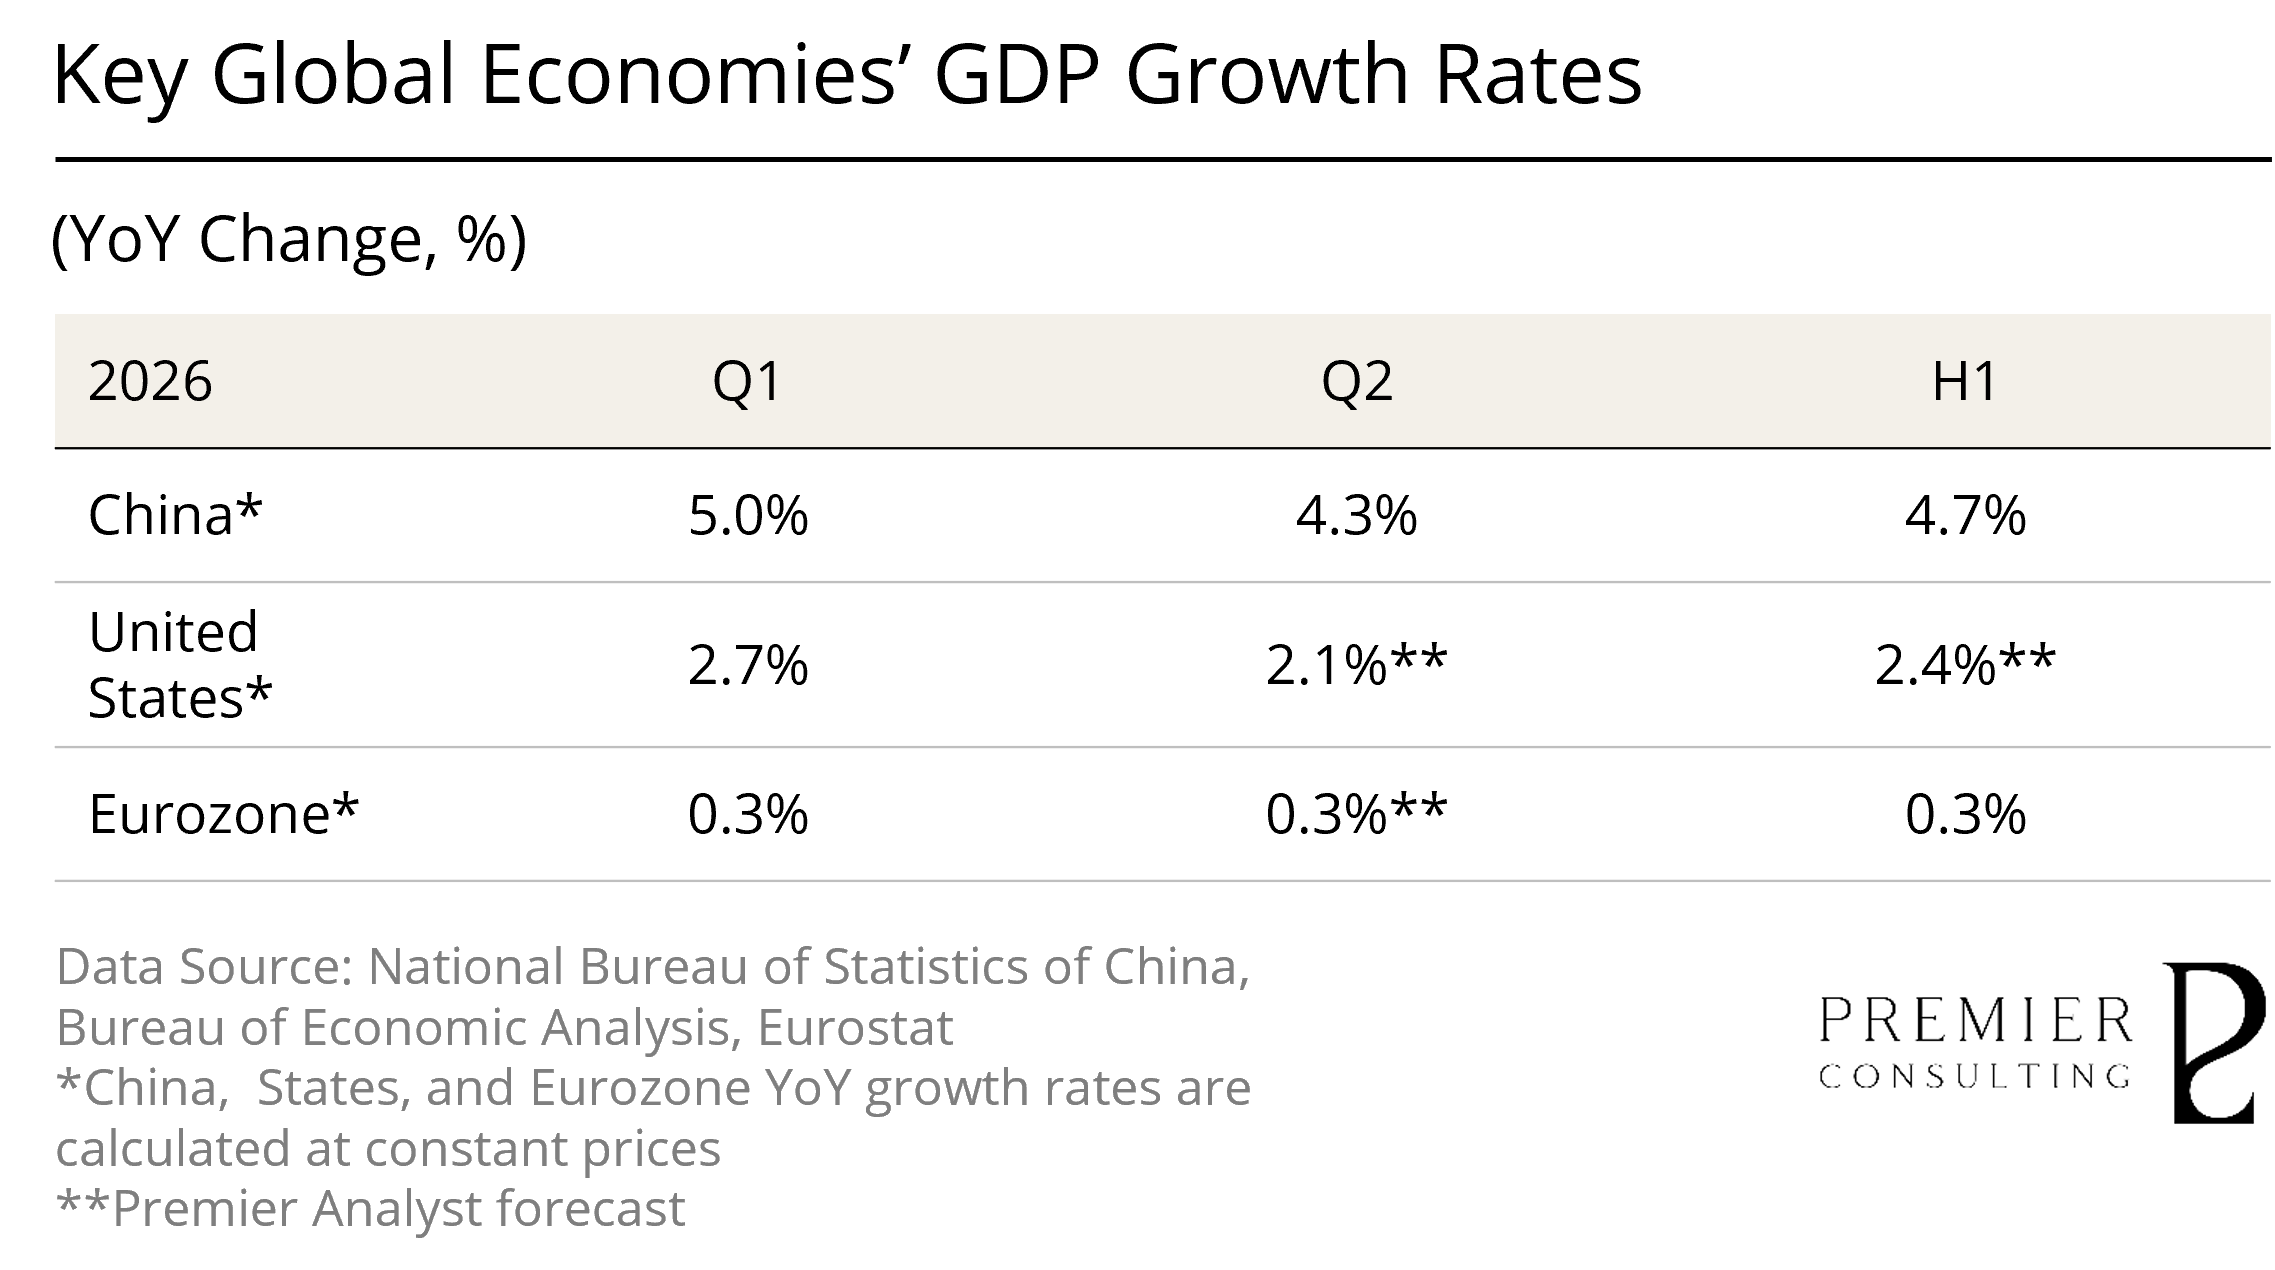
Global: Resilient Growth amid Deepening Structural Divergence and Elevated Frictions
In the first half of 2026, the global economy avoided a synchronized downturn and sustained moderate expansion despite a succession of external shocks. Consumption and technology investment continued to support activity in the United States, China maintained a steady growth trajectory, and the euro area progressed through a gradual recovery from a low base. Major institutions broadly place global growth for 2026 within a range of 2.5%–3.0%. While below the average pace recorded in recent years, this outlook still points to a meaningful degree of underlying resilience.
Growth momentum across developed economies remained generally subdued, while emerging markets continued to account for a larger share of global expansion. Regional disparities nevertheless widened as differences in energy-import dependence, debt burdens, and access to external financing became more pronounced. Global inflation remained on a broad downward path, but conflict in the Middle East, energy-price volatility, and tariff pass-through rendered the disinflation process increasingly uneven. Global trade, meanwhile, remained broadly stable as companies continued to reconfigure supply chains, diversify end markets, and deepen regionalized operating networks.
At the policy level, major central banks shifted away from a singular focus on inflation control toward a more balanced consideration of price stability, growth, and financial-system resilience. Monetary policy became increasingly data-dependent, with greater emphasis placed on the timing and calibration of policy adjustments. Fiscal priorities, in parallel, tilted further toward defense, energy security, infrastructure, and technology investment. Global equity markets remained broadly resilient, supported by sustained investment in artificial intelligence and continued corporate earnings delivery. Yet heightened volatility across interest rates, exchange rates, and commodity prices reflected persistent disagreement over the quality of growth and the extent of available policy space.
Looking ahead to the second half of 2026, the global economy is expected to maintain a moderate pace of expansion, although the breadth of growth and the degree of regional synchronization may weaken further. The duration of geopolitical conflict and energy-market disruption, the evolution of tariff policy, the intensity of technology investment, and the effectiveness of policy transmission will jointly shape the subsequent growth trajectory. The global economy is moving away from synchronized expansion under relatively low-friction conditions and toward a more structurally differentiated growth regime, increasingly defined by technology cycles and regional rebalancing.
On inflation and monetary policy, the global disinflationary trajectory became more uneven in 2026. Conflict in the Middle East pushed energy and food costs higher, while tariff pass-through further delayed the normalization of goods prices, narrowing the policy latitude available to major central banks. The Federal Reserve and its peers are therefore more likely to retain a cautious, data-dependent stance, balancing the need to support growth against the risk of renewed inflation persistence. In some economies, these pressures may even revive the prospect of policy tightening.
Regional divergence remained pronounced. The United States continued to expand at a moderate pace, supported by consumption and technology investment, although elevated interest rates and a cooling labor market gradually narrowed the breadth of growth. The euro area remained on a subdued recovery path, with fiscal investment increasingly taking over from monetary easing, while manufacturing activity and external demand remained weak. Asia’s technology supply chains benefited from artificial intelligence-related demand, whereas energy-importing economies faced more acute cost pressures. Across Latin America and Africa, slower trade, tighter financing conditions, and commodity-price volatility constrained the recovery, leaving its foundations comparatively fragile. Global trade continued to provide a degree of support, but geopolitical conflict, tariff barriers, and ongoing supply-chain reconfiguration remained the principal downside risks.
[For more insights, please download the full report]
Consumer Confidence Index
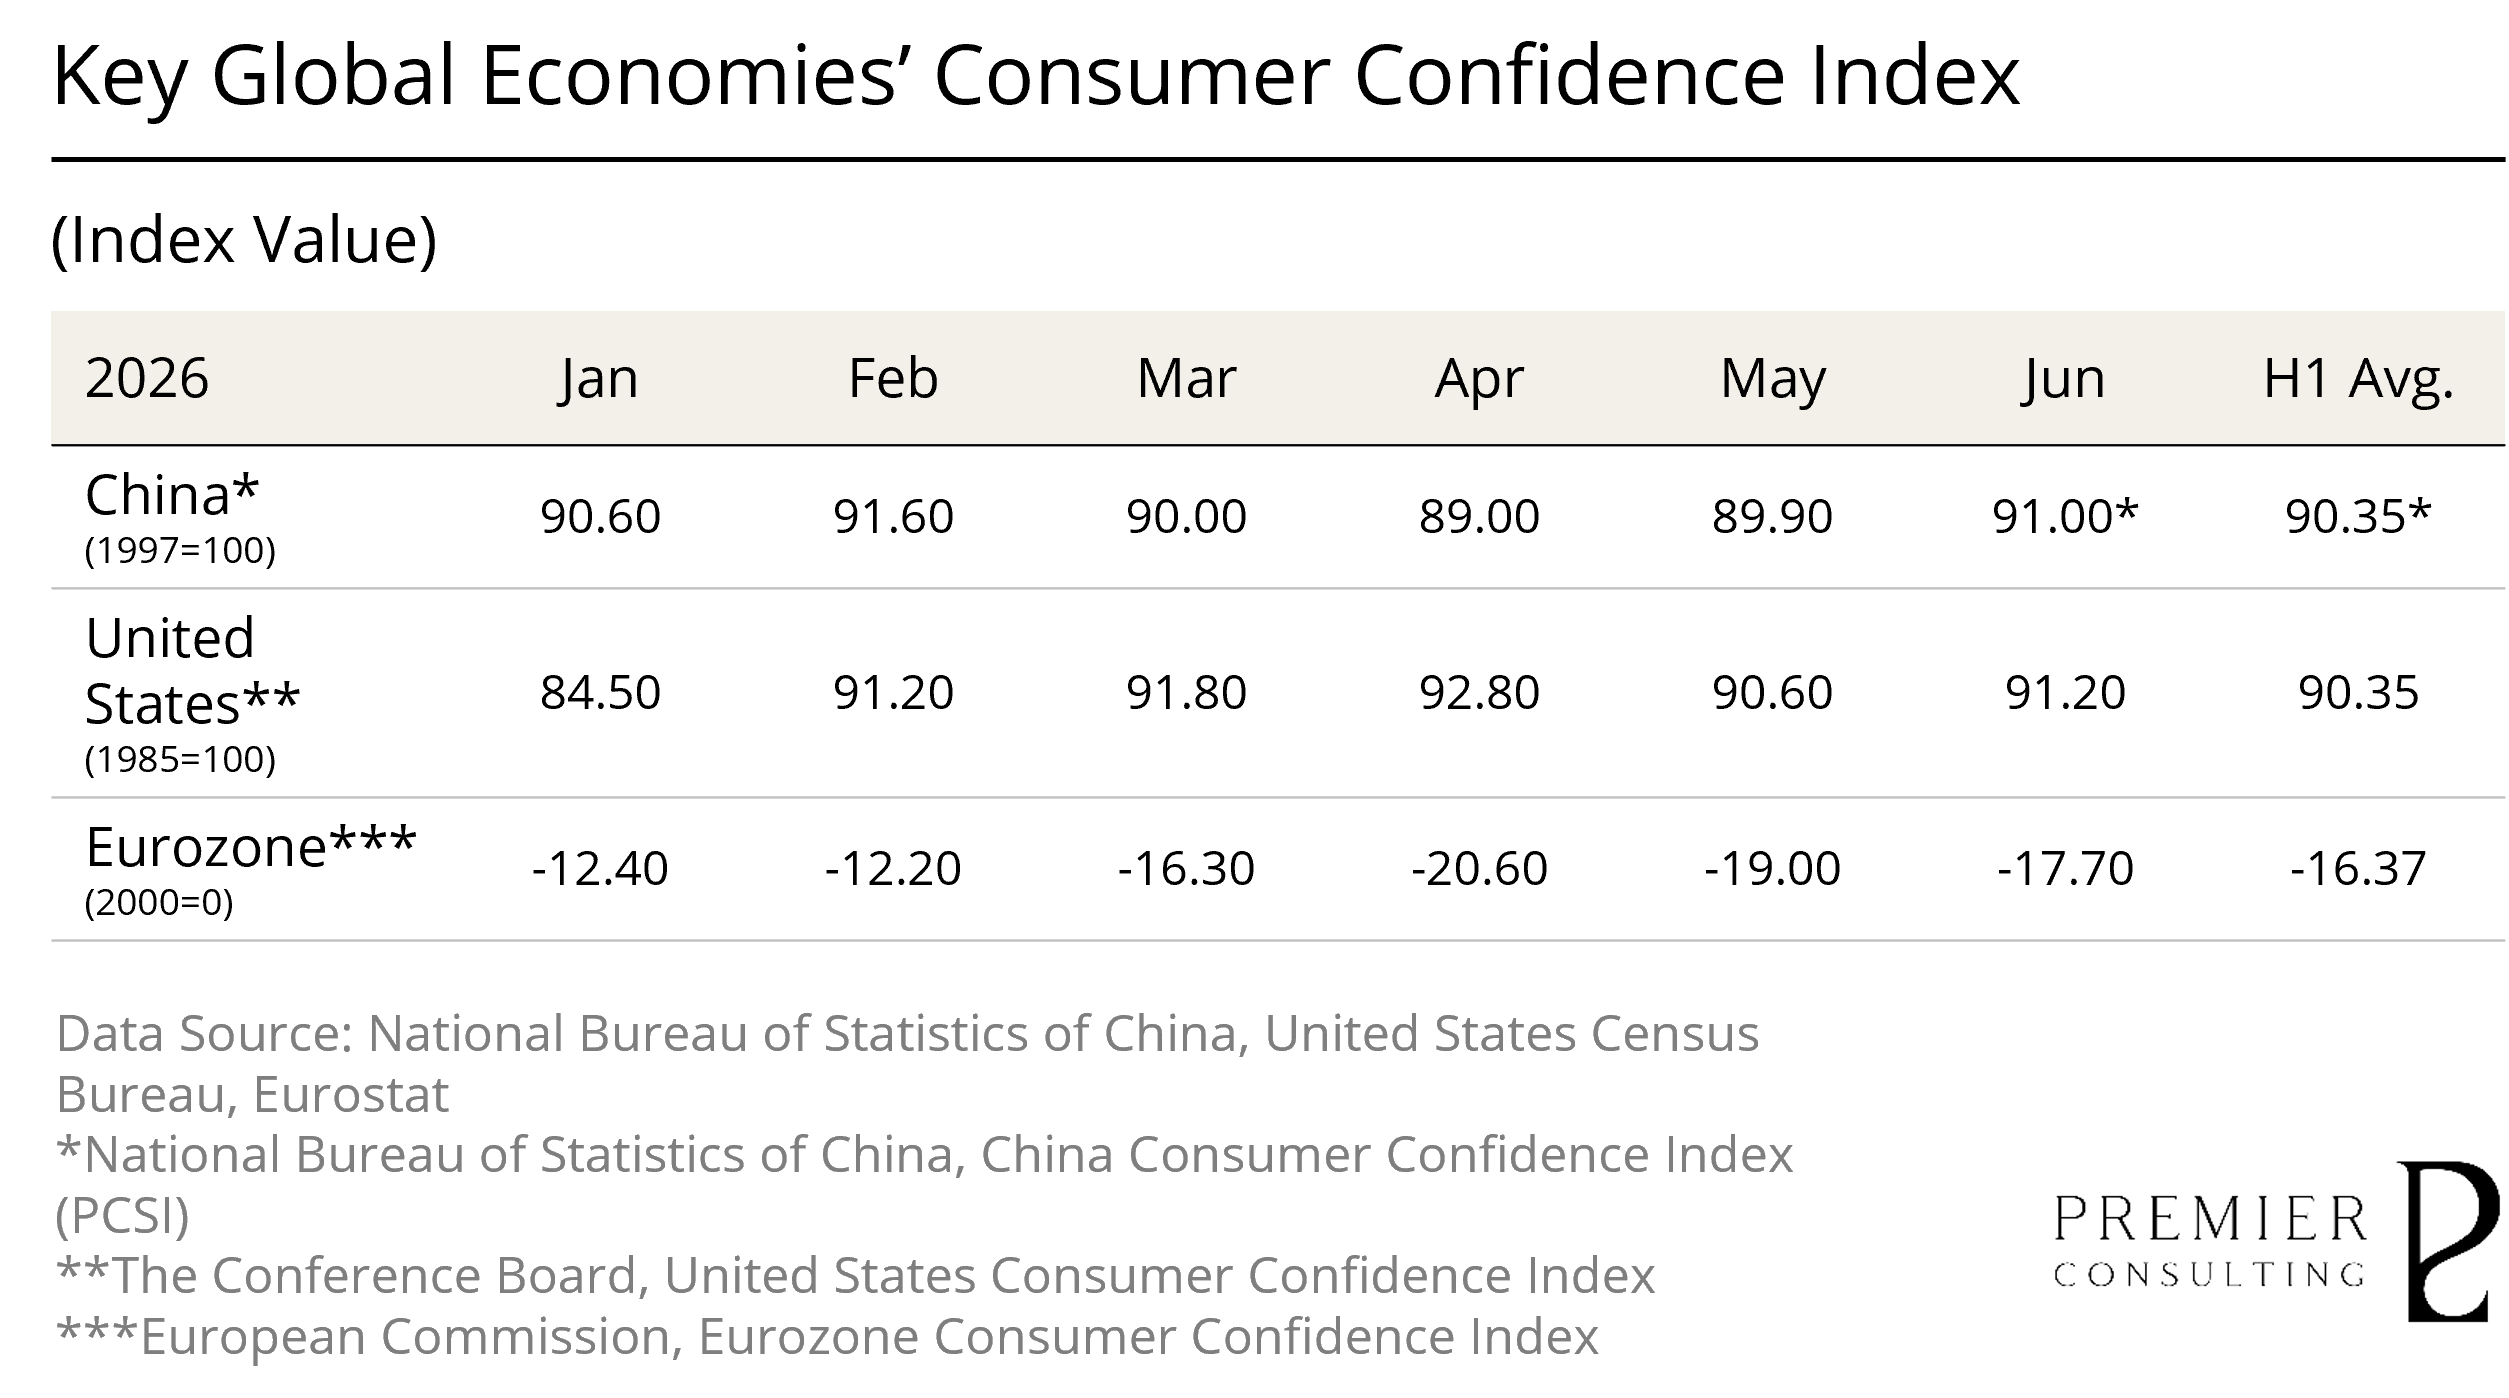
China: Employment Anchors Confidence Recovery, Domestic Demand Awaits Stronger Expectations
In the first half of 2026, China’s consumption profile was defined by rising household incomes alongside continued restraint in spending. Total retail sales of consumer goods increased by 1.3% year over year, with growth easing to 1.0% in June, leaving the expansion in consumption still largely reliant on policy support and selective recovery across individual categories. Per capita disposable income rose by 5.2% in nominal terms and 4.2% in real terms, while real per capita consumption expenditure increased by only 2.7%. As shown in the chart, the Consumer Confidence Index averaged 90.35 during the first half, declining to 89.00 in April before its forecast value recovered to 91.00 in June. Confidence therefore showed tentative signs of improvement, but the recovery had yet to translate into a broad-based and sustained willingness to spend.
Employment conditions remained broadly stable. The nationwide surveyed urban unemployment rate averaged 5.2% in the first half and declined gradually through the second quarter, indicating that employment-stabilization policies continued to provide an effective floor. Beneath the aggregate stability, however, mismatches persisted between labor demand and workforce skills, as well as between industry conditions and regional employment opportunities. These structural frictions continued to weigh on employment quality and income expectations for certain groups, transmitting into household confidence through the link between employment expectations and the propensity to consume.
Price conditions remained moderate overall. CPI increased by 1.0% year over year in the first half, suggesting that demand-side pressures had yet to generate meaningful inflation. PPI rose by 1.5%, although the recovery was concentrated primarily in energy and raw materials, while prices for consumer goods continued to decline year over year. The coexistence of rising upstream costs and subdued end demand points to an uneven transmission of price pressures, with improvements in corporate profitability not yet translating fully into stronger consumption confidence among households.
Looking ahead to the second half of 2026, consumer confidence is expected to continue recovering from subdued levels. Whether that improvement can be sustained will depend on the extent to which three critical transmission channels generate visible and verifiable gains in the real economy.
First, the ability of employment stability and improved job quality to lift household income expectations will determine whether discretionary consumption and medium- to long-term expenditure can be released. Second, further easing in property-market and household balance-sheet pressures will be essential to restoring household risk appetite and reducing precautionary savings at the margin. Third, the effectiveness of consumption-support measures and durable-goods replacement programs will depend on whether they can evolve from temporary stimulus into sustained demand, while broader service provision, improved supply, and innovation in consumption scenarios strengthen households’ willingness to spend.
Employment is likely to retain a pattern of aggregate stability alongside persistent structural divergence. The overall unemployment rate is expected to remain broadly steady, although differences across industries and demographic groups will continue to shape households’ marginal propensity to consume. The capacity of the services sector to absorb labor, the quality of employment created by the new economy, and the efficiency of skills matching will remain the principal variables determining the pace at which employment expectations and consumer confidence recover.
[For more insights, please download the full report]
Retail Sales Growth Review & Outlook
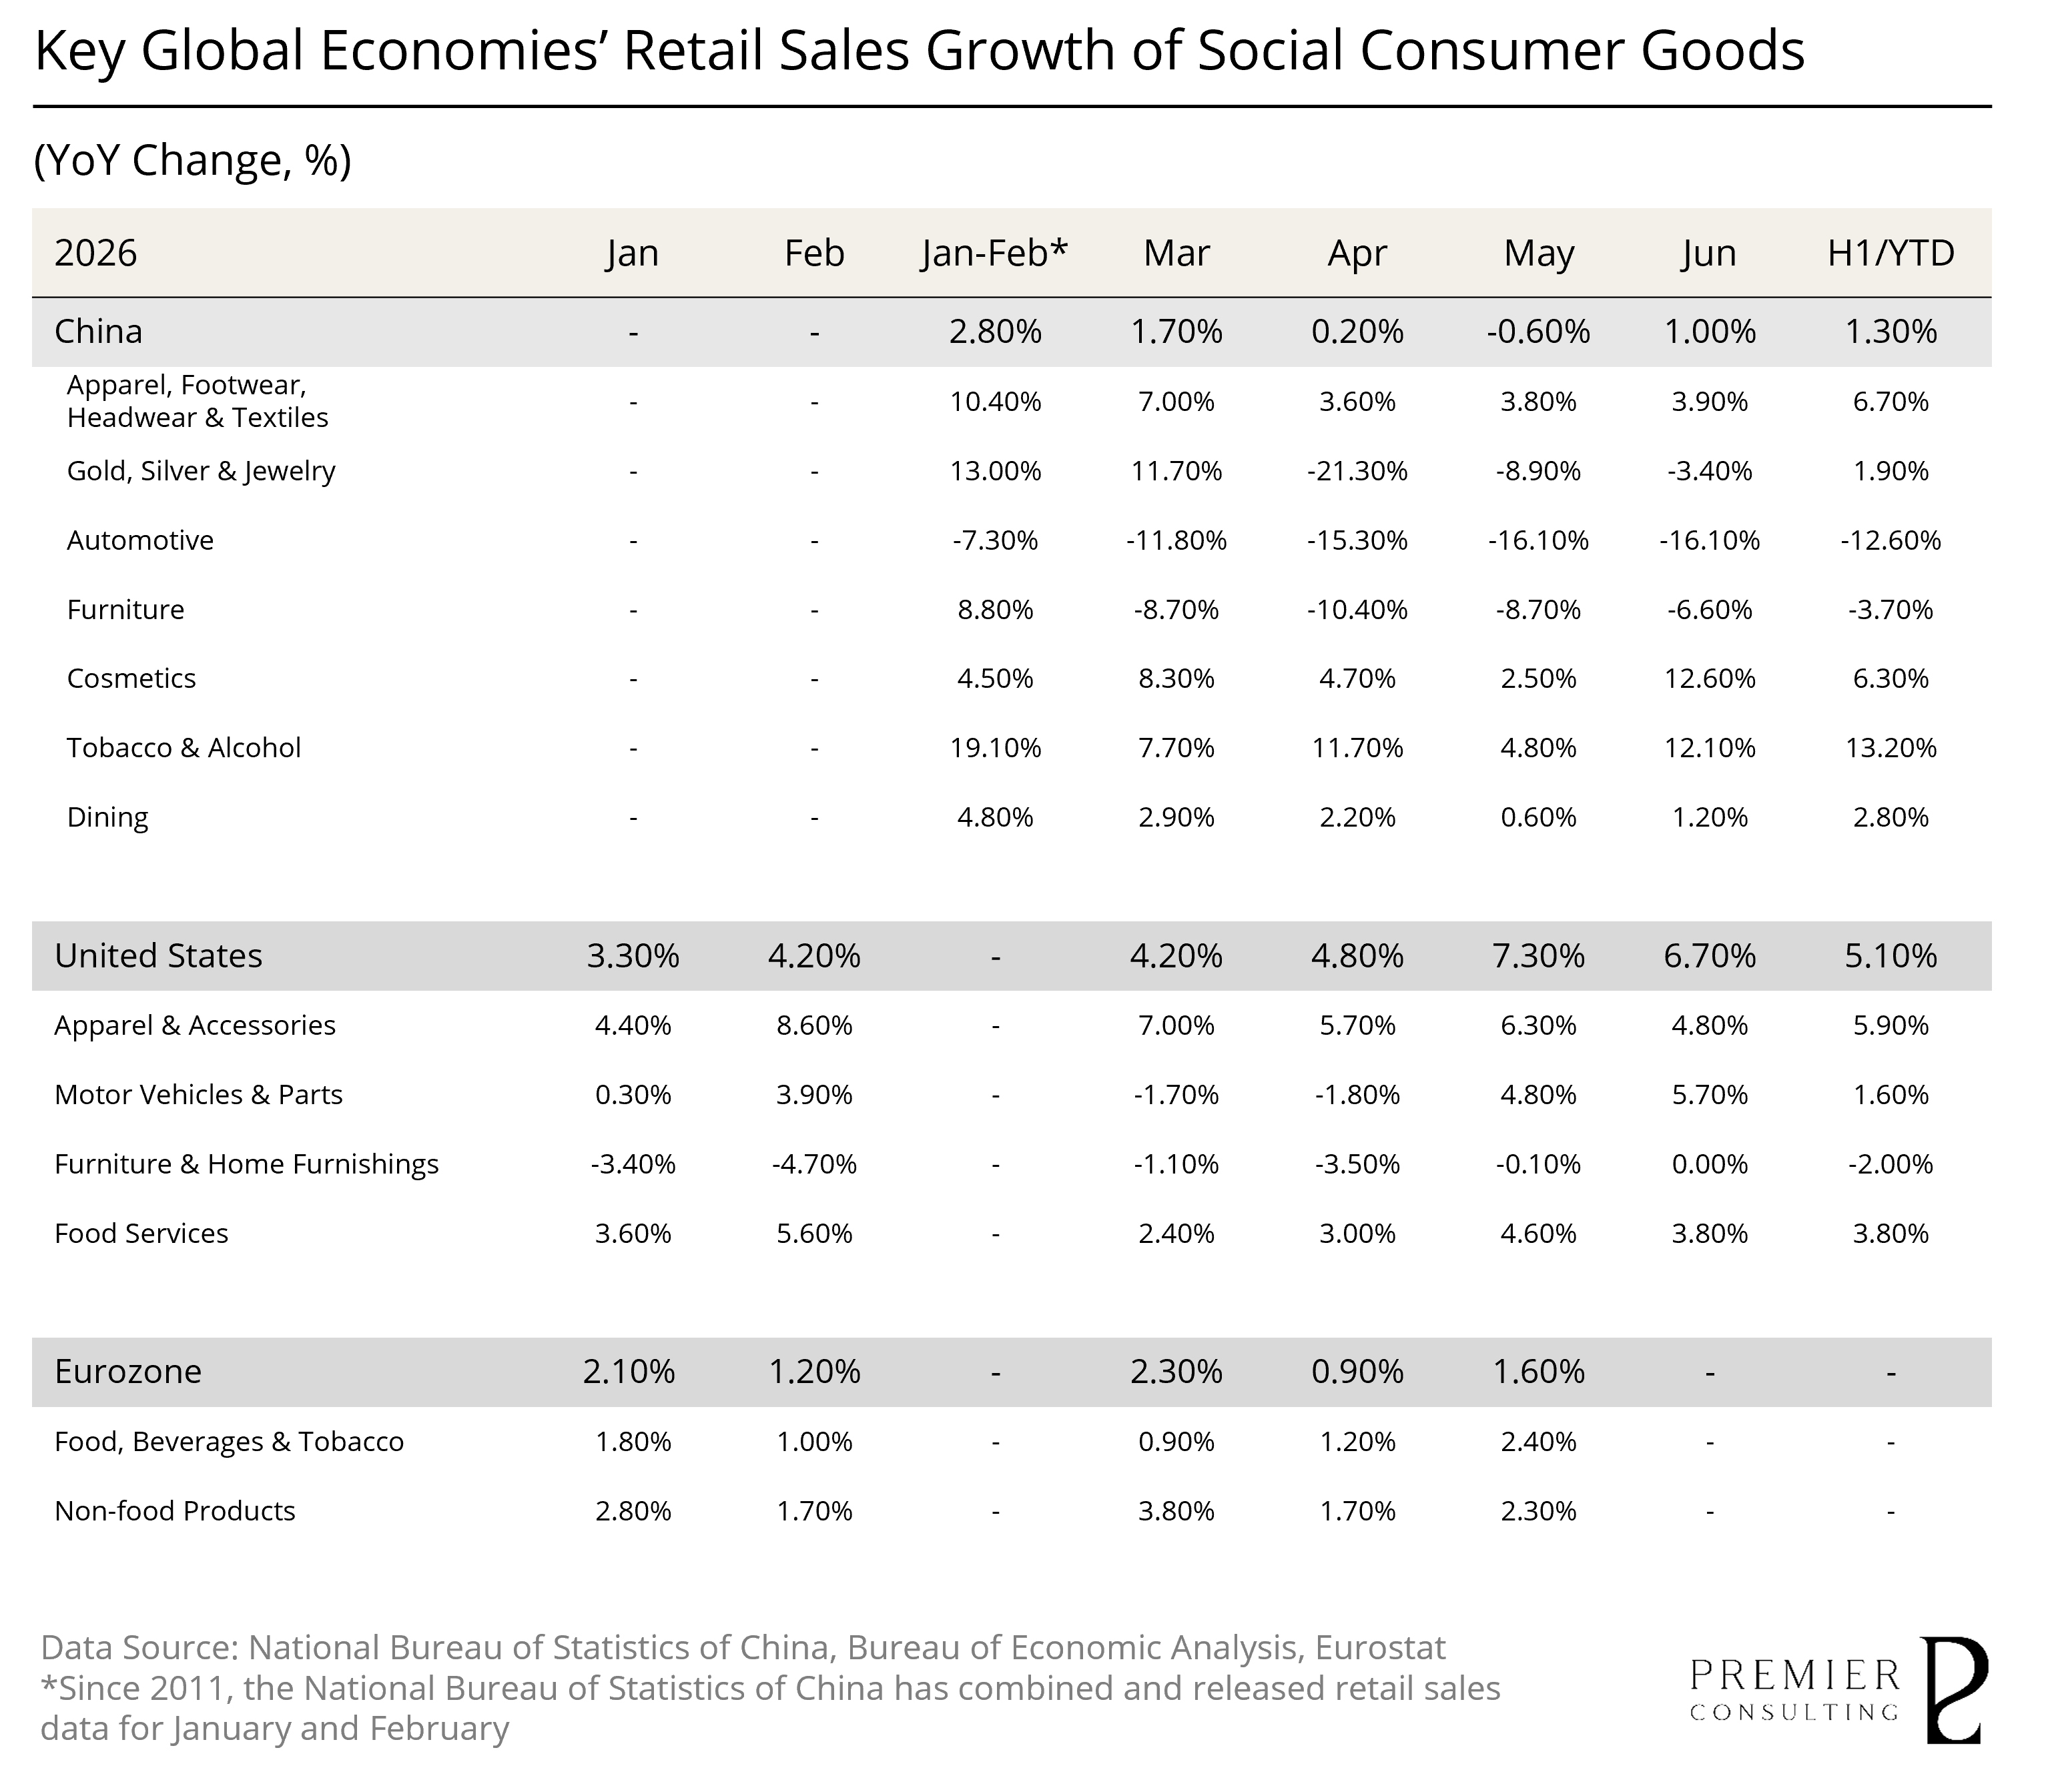
China: Structural Divergence Persists as Consumption Reorients toward Tangible Value
According to data released by the National Bureau of Statistics, China’s total retail sales of consumer goods reached RMB 24.8722 trillion in the first half of 2026, representing year-over-year growth of 1.3%. The consumer market therefore remained in expansion, although the pace of recovery was still measured. Retail sales excluding automobiles increased by 2.8%, indicating comparatively greater resilience across other consumption categories. The underlying data also pointed to widening structural divergence: tobacco and alcohol, apparel and footwear, and cosmetics grew by 13.2%, 6.7%, and 6.3%, respectively, while gold, silver, and jewelry rose by 1.9%. Automobile and furniture sales, by contrast, declined by 12.6% and 3.7%, further widening the gap in recovery momentum across categories.
Within this evolving consumption landscape, luxury goods and other discretionary categories remained an important source of divergence during the first half. These segments are more directly influenced by household income expectations, consumer confidence, and wealth effects, resulting in a more distinctly differentiated recovery. Apparel and beauty products, which combine functional utility, emotional value, and comparatively low decision thresholds, retained stronger resilience. Higher-ticket categories such as jewelry, automobiles, and home furnishings recovered more slowly, reflecting greater consumer scrutiny of price movements, purchase timing, and the tangible value delivered by each transaction.
Discretionary consumption nevertheless remained under cyclical pressure. With income expectations and consumer confidence yet to recover fully, households became more inclined to defer major optional purchases while placing greater emphasis on price, quality, and practical utility. Spending consequently became more concentrated in perceptible sources of value, including materials, craftsmanship, scarcity, service experience, and relevance to actual consumption occasions. Volatility in luxury consumption therefore reflected shifts in purchasing priorities and decision cycles more than an outright disappearance of demand. Brand performance will increasingly depend on product strength, the clarity and credibility of value communication, and more refined management of distinct customer segments.
Looking ahead to the second half of 2026, China’s consumer market is expected to continue along a path defined by policy support and structural recovery. Consumer-goods trade-in programs, the expansion of service consumption, and the cultivation of new consumption scenarios will remain important levers for strengthening domestic demand. For luxury and other discretionary categories, the effects of these measures are likely to be more indirect: by stabilizing employment and income expectations, revitalizing offline consumption settings, and improving both the consumption environment and the quality of supply, policy support may gradually reduce the uncertainty premium embedded in household purchasing decisions and facilitate a marginal recovery in discretionary spending.
Against this backdrop, retail-sales growth is expected to improve moderately in the second half from its first-half pace, although the strength of the full-year recovery will remain contingent on employment and income conditions, consumer confidence, and the stabilization of major-ticket categories such as automobiles. Consumption is likely to continue shifting toward services, high-quality experiences, emotional value, and intelligent-living solutions, while online retail and emerging lifestyle categories retain relative growth advantages. Over the medium to long term, the durability of consumption growth will depend on stronger household incomes, a recovery in wealth effects, and sustained innovation across the consumer supply landscape.
[For more insights, please download the full report]

PRIMARY INDEX REVIEW & PROSPECT
Channel Adjustments Signaling Demand Divergence,
Macro Expectations Reshaping Index Valuations
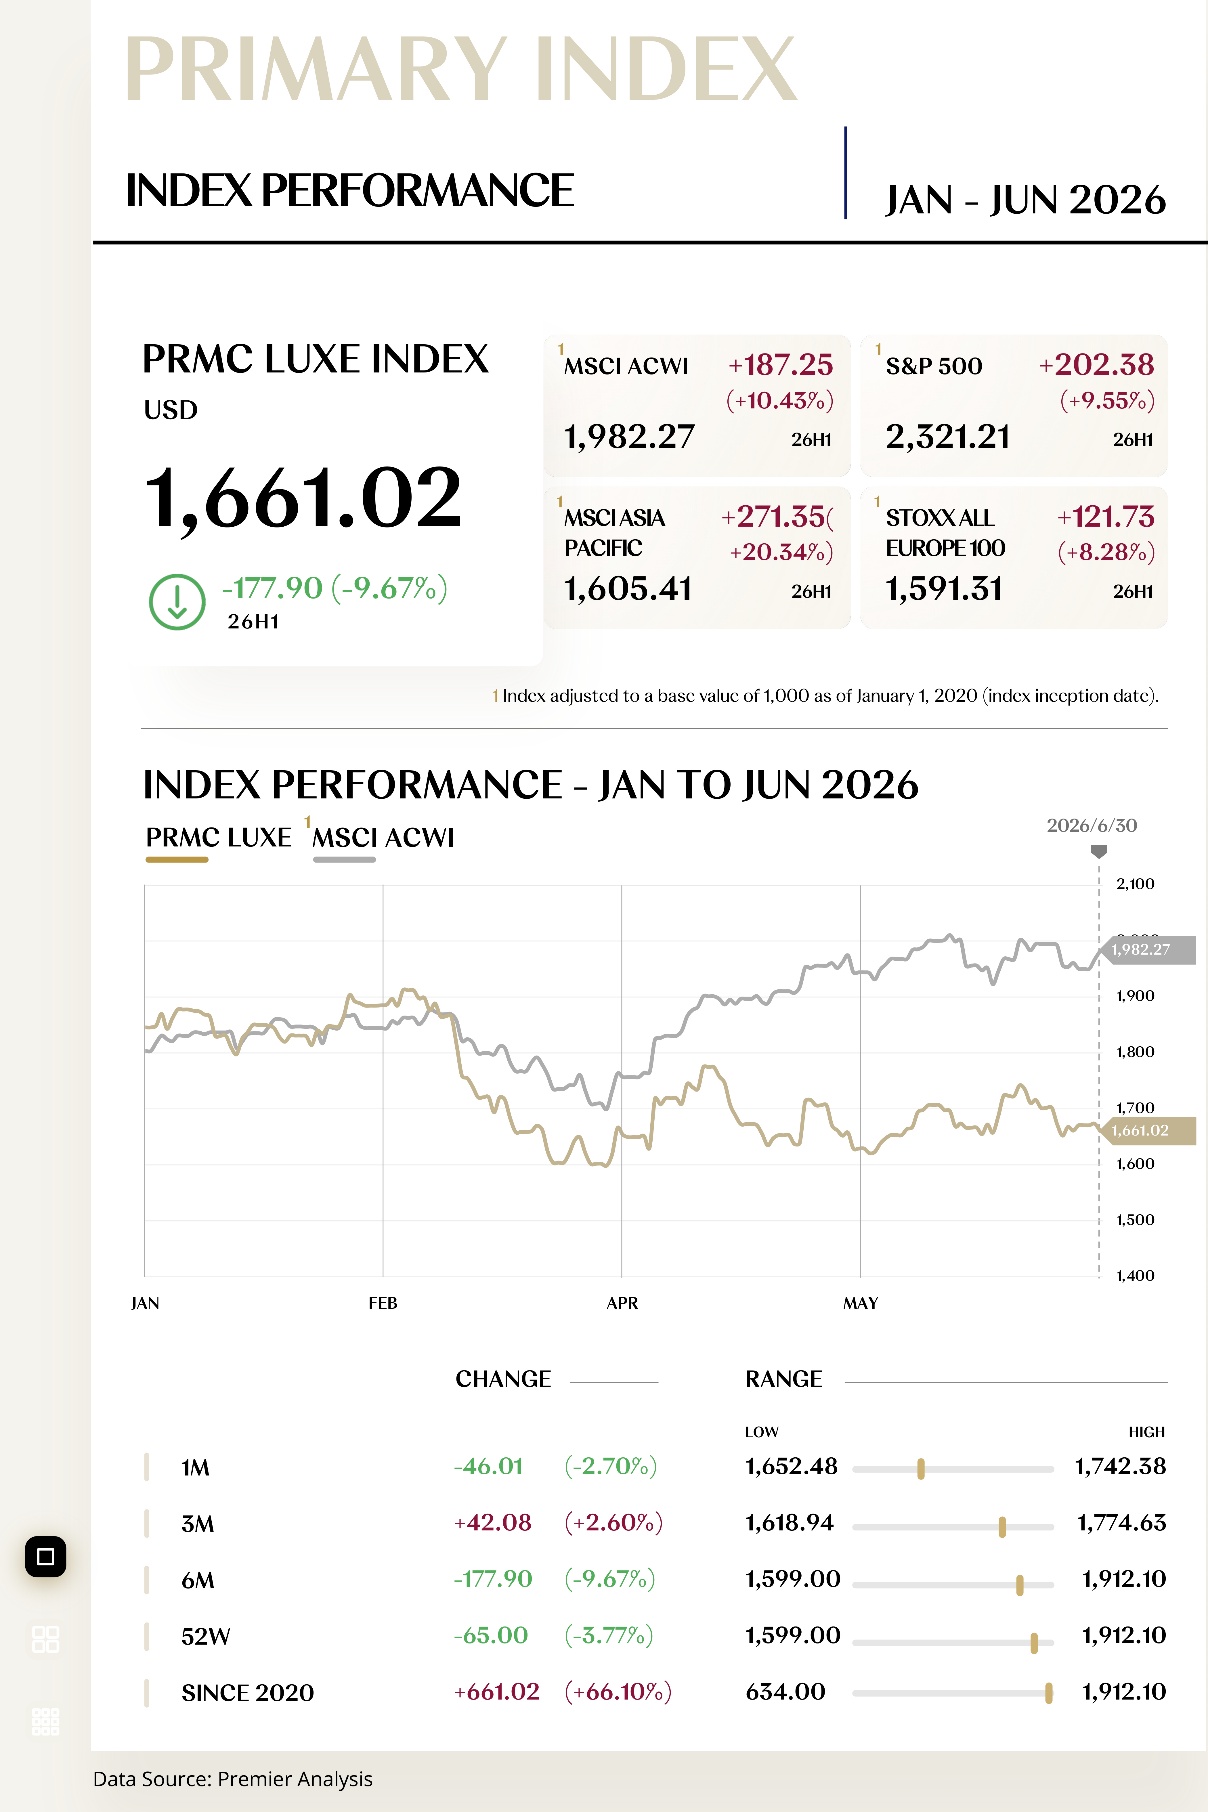
As of June 30, 2026, the PRMC Luxe Index closed at 1,661.02 points, declining by 177.90 points over the first half of the year, equivalent to a fall of 9.67%.
Across the first half, the index followed a distinct trajectory of “measured advance—sharp retracement—limited recovery—renewed pressure.” It edged higher in January and February on positive wealth effects and expectations of a recovery in Asian demand, before falling sharply in March under the combined impact of geopolitical escalation, higher oil prices, and adverse currency translation. A partial recovery followed in April and May as risk appetite improved and earnings performance diverged, but the index weakened again in June as European interest rates rose and Chinese domestic demand remained subdued. Overall, the market entered a phase defined by valuation validation and widening structural dispersion.
In January and February, a measured rise in the index coincided with increasingly visible internal rotation. Gains across global equity markets supported the valuation of premium consumer assets through the wealth-effect channel, while expectations of a recovery in Asian travel-related consumption provided an additional tailwind. At the same time, pressures from end-market traffic, product cadence, and brand transformation began to surface first within the Core Luxe segment. Market preference consequently shifted toward companies offering stronger order visibility, scarcer supply, or more stable experience-led cash flows, leaving the sector resilient in aggregate even as internal pricing began to diverge.
In March, the index underwent a pronounced retracement as the escalation of conflict in the Middle East lifted the risk premium. Higher oil prices not only raised costs across aviation, cruises, and logistics, but also reinforced expectations of renewed inflation and higher interest rates. At the same time, disruptions to regional store traffic and greater currency-translation losses on European assets prompted investors to lower assumptions for reported revenue, margins, and valuation. The correction therefore represented a concentrated reassessment of macro sensitivity and earnings visibility, rather than a systemic rejection of the long-term demand case for premium consumption.
From April to May, the index entered a limited recovery phase, supported by three converging factors. First, the marginal easing of geopolitical disruption and an improvement in risk appetite restored a degree of valuation support for higher-quality consumer assets. Second, earnings releases further confirmed a pattern of “resilience at the high end, broader pressure elsewhere,” validating the operating stability of jewelry, ultra-luxury, and selected experiential assets. Third, widening differences in full-price sell-through, inventory discipline, and cost efficiency among market leaders redirected capital toward companies with superior earnings quality. The recovery was therefore not a broad-based rebound, but a selective reallocation grounded in operating evidence.
In June, the index came under renewed pressure as macroeconomic and policy variables once again became the dominant drivers of the risk premium. Rising European interest rates, firmer energy-inflation expectations, and weak Chinese domestic demand jointly weighed on sector valuations. At the same time, internal industry dispersion intensified: companies with stronger brand equity, greater full-price selling capability, and more stable cash flow remained comparatively resilient, while those more dependent on middle-income demand, a single region, or promotional channels experienced materially deeper declines.
[For more insights, please download the full report]

SECONDARY INDEX REVIEW & PROSPECT
Ultra Luxe Leading and Core Luxe Stabilizing,
Mass Luxe Recovering and Experiential Luxe Accelerating
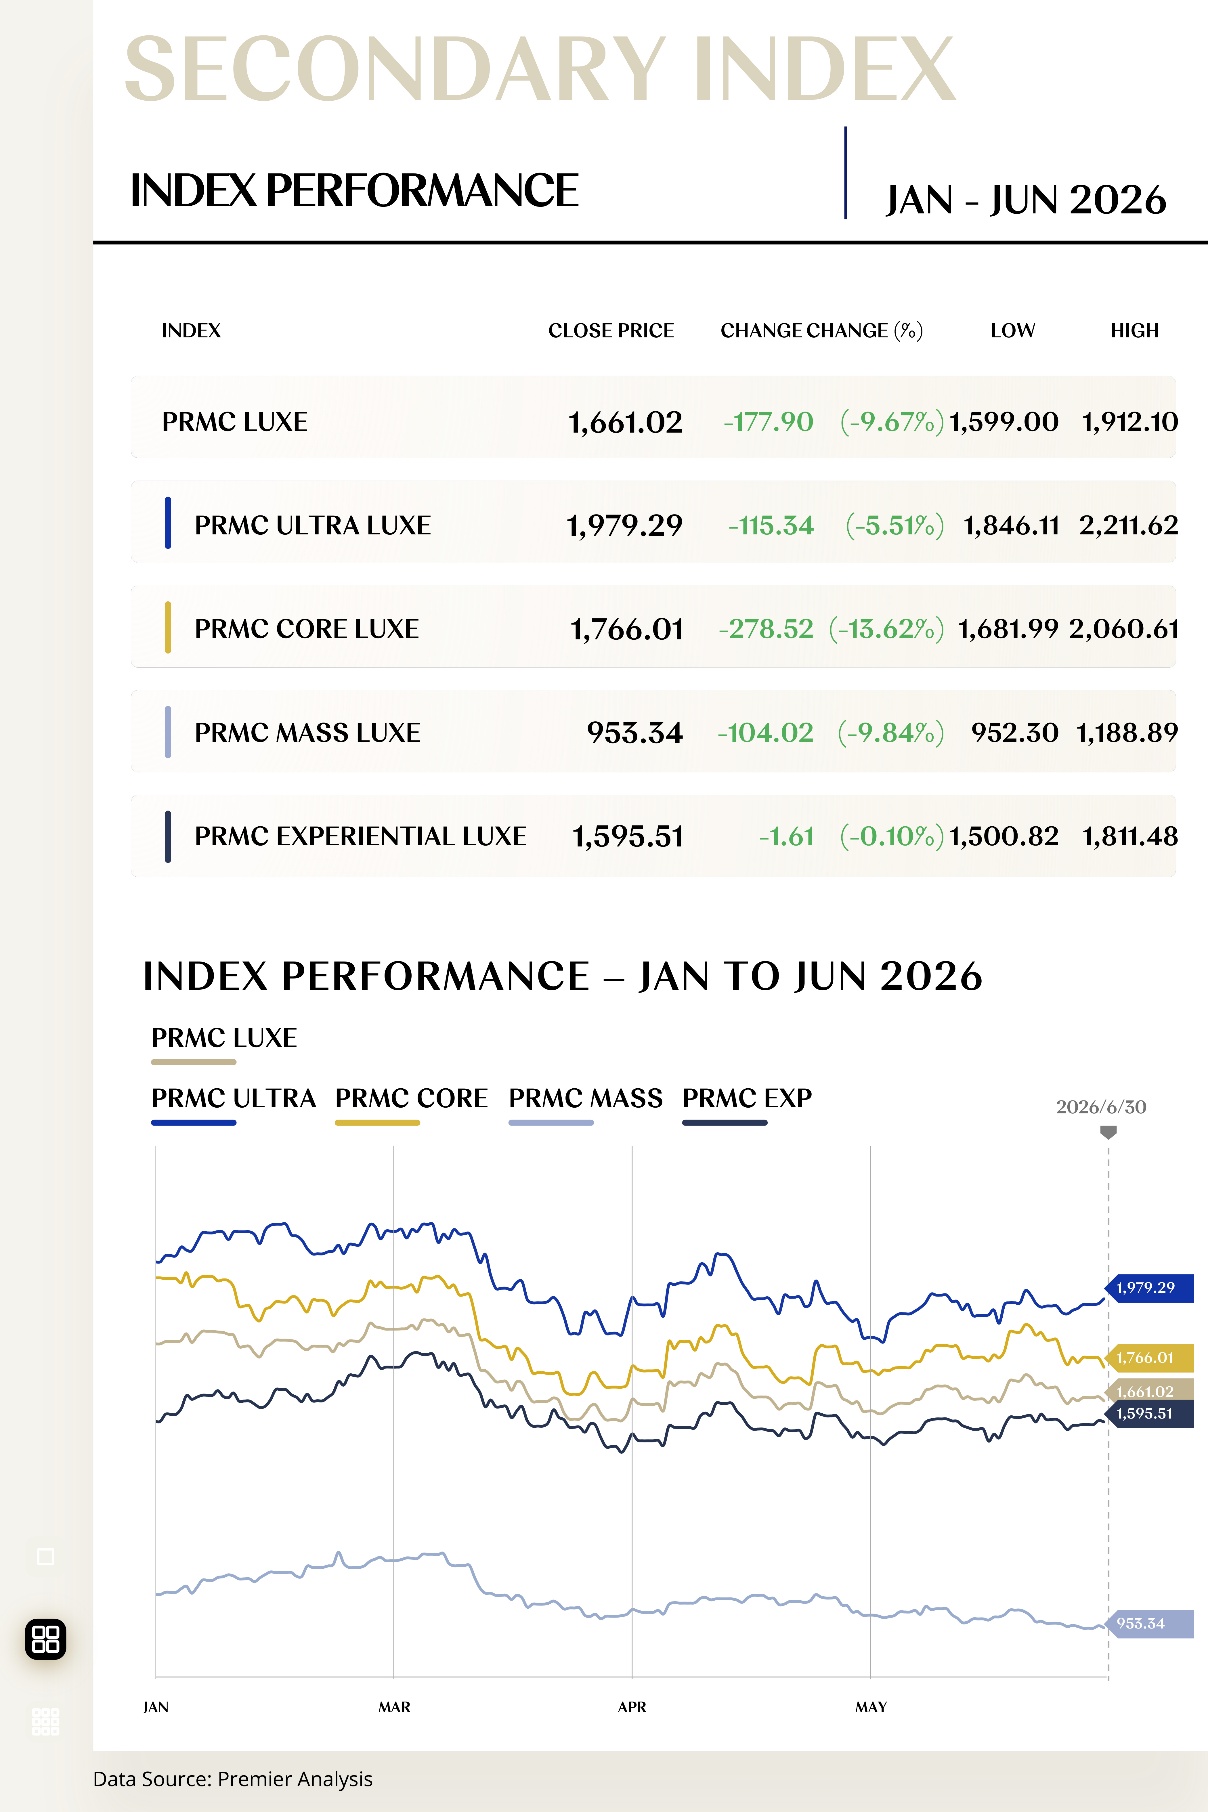
As of June 30, 2026, the PRMC Core Luxe Index closed at 1,766.01 points, declining by 278.52 points over the first half of the year, equivalent to a fall of 13.62%.
This decline did not reflect uniform weakness across the segment. Rather, it marked a structural repricing shaped by the sharper deterioration in soft luxury, the relative resilience of hard luxury, and the amplifying effect of adverse currency movements.
Global luxury demand moved decisively from recovery expectations toward validation through operating performance. Spending became increasingly concentrated among asset-rich consumers and within high-ticket categories offering stronger value-retention characteristics. At the same time, geopolitical tensions, rising energy prices, and higher European interest rates lifted the sector risk premium. Together with adverse currency translation for European companies, these pressures raised the valuation threshold for both earnings quality and delivery certainty.
Within the jewelry and watches sector, the market developed a clear structure in which jewelry provided a degree of downside support while watch performance became increasingly polarized. Gold’s store-of-value appeal, together with wedding, gifting, and high-net-worth demand, continued to underpin jewelry consumption, with both LVMH’s Watches and Jewelry division and Kering’s jewelry businesses recording growth. Leading jewelry houses further preserved relatively stable full-price sell-through and profit structures through iconic collections, scarce materials, and deep relationships with high-end clients. Watches, by contrast, became more stratified as channel destocking progressed and the secondary market cooled. Rare and high-end models retained their appeal, while broader demand and export performance remained under pressure.
The fashion and leather goods sector constituted the principal drag on the Core Luxe Index, with performance increasingly determined by the strength of individual product cycles and the pace of brand transformation. Repeated price increases more frequently tested the limits of demand elasticity, reducing the market’s tolerance for growth sustained primarily through pricing. Investor scrutiny therefore shifted toward whether brands could demonstrate genuine creative renewal, strengthen the relevance of iconic products, and preserve full-price selling capability.
Although Asian traffic and cross-border consumption improved in selected markets, the regional recovery remained uneven. Seasonal execution challenges, elevated channel inventories, and continued wholesale contraction compounded this divergence, leaving the earnings landscape characterized by relative strength in jewelry, persistent pressure across fashion and leather goods, and a widening performance gap between market leaders and weaker tail-end brands.
As of June 30, 2026, the PRMC Ultra Luxe Index closed at 1,979.29 points, declining by 115.34 points over the first half of the year, equivalent to a fall of 5.51%.
The decline reflected a structural adjustment rather than a broad deterioration in ultra-luxury fundamentals. Resilient demand among high-net-worth consumers and the scarcity of supply provided a meaningful valuation floor, while geopolitical risk and softer conditions across selected end markets constrained the index’s performance.
Global luxury consumption continued to operate within a broader environment of slowing growth and increasingly pronounced customer segmentation. Ultra-high-net-worth consumers nevertheless retained comparatively robust balance sheets and purchasing power, allowing capital markets to continue assigning premiums to companies offering visible order books, dependable delivery schedules, and superior cash-flow quality.
This resilience was reinforced by the structural characteristics of private jet, private yachts, and luxury cars. Long order cycles, extensive customization, and tightly controlled supply allowed accumulated backlogs to absorb fluctuations in immediate demand, providing an effective buffer against macroeconomic volatility. As a result, the Ultra Luxe Index recorded a materially shallower drawdown than both the Core Luxe and Mass Luxe indices.
Within the private jet sector, support continued to derive from the combined strength of premium business-travel demand, long-duration order books, and recurring after-sales revenue. Bombardier, for example, reported a first-quarter backlog of US$20.3 billion, while services revenue increased by approximately 25% year over year. The interaction of delivery execution and aftermarket cash generation consequently provided a high degree of earnings visibility.
The private yachts sector displayed a similarly defensive profile, underpinned by scarce production capacity and the contractual visibility of high-end orders. Through bespoke design, direct client relationships, and disciplined delivery scheduling, leading manufacturers were able to distribute near-term demand volatility across longer order cycles, preserving relative stability in pricing architecture and margins.
Sanlorenzo’s disclosed operating performance illustrates this model. First-quarter order intake rose by 25.4% year over year, while the order backlog exceeded €1 billion, approximately 90% of which originated directly from end customers. Market valuation therefore remained more closely anchored to order quality, production execution, and cash conversion than to fluctuations in any single quarter’s sales volume.
Within the luxury car sector, differentiation became increasingly dependent on brand pricing power and product mix. Ferrari’s first-quarter revenue increased by 3% year over year, or 6% at constant exchange rates, with personalization and constrained supply continuing to support revenue per vehicle. By contrast, softer Chinese demand, tariff pressures, and product-transition requirements weighed more heavily on manufacturers whose earnings remained more exposed to volume growth and regional market conditions.
The furniture and home furnishings sector retained a more conventionally cyclical profile, reflecting their sensitivity to discretionary spending, property markets, and interest rates. Ethan Allen reported broadly stable retail orders alongside a 7.6% decline in wholesale orders. Although elevated margins and disciplined inventory management provided a degree of protection, the segment’s contribution to the index remained episodic and less durable than that of aviation and yacht businesses supported by locked-in order books.
As of June 30, 2026, the PRMC Mass Luxe Index closed at 953.34 points, declining by 104.03 points over the first half of the year, equivalent to a fall of 9.84%.
The index’s retreat reflected a widening imbalance across its underlying categories. Fragrance and beauty retained relative resilience through their more accessible luxury positioning, yet this strength was insufficient to offset the combined drag from spirits destocking, broader pressure on discretionary demand, and channel-led valuation compression.
The fragrance and cosmetics sector remained an important source of support. In an uncertain consumption environment, households showed a stronger preference for lower-ticket purchases capable of delivering immediate emotional value. Supported by frequent repurchase, strong brand premiums, and relatively modest transaction values, fragrance and makeup consequently demonstrated greater revenue resilience than larger-ticket discretionary categories.
This resilience was reinforced by the recovery in China’s premium beauty demand, continued expansion in fragrance and high-end haircare, and sustained progress across product innovation, dermatological beauty, and multichannel execution. L’Oréal’s first-quarter like-for-like sales growth of 7.6% further underscored the beauty segment’s superior operating visibility and defensive characteristics within the Mass Luxe universe.
The wine and spirits sector, by comparison, represented the principal drag on index performance. The segment remained exposed to two interrelated pressures: the pace of channel inventory normalization and wholesale destocking in core markets such as the United States; and regional disruption arising from changes in China’s premium banqueting demand, price mix, and broader trade conditions.
Operating disclosures from leading producers confirmed that both end demand and distribution channels remained in adjustment. Diageo reported a 2.8% decline in organic sales during the first half, while Pernod Ricard recorded a 5.9% organic sales decline over its fiscal first half. In response, spirits companies continued to pursue cost reductions, portfolio optimization, and tighter pricing discipline to defend profitability and preserve cash-flow stability.
As of June 30, 2026, the PRMC Experiential Luxe Index closed at 1,595.51 points, declining by 1.61 points over the first half of the year, equivalent to a fall of 0.10%.
The index’s broadly flat first-half performance reflected a near offset between resilient demand for experience-led consumption and persistent pressure on operating economics. Premium travel, hospitality, and offline experiences have moved beyond the phase of compensatory recovery into a more normalized growth cycle, with bookings and visitor flows continuing to provide support. This revenue resilience, however, did not translate fully into index appreciation, as elevated energy prices, route adjustments, and structurally high fixed costs constrained margin conversion.
Within this landscape, the cruising sector remained an important source of support. Strong booking momentum, higher ticket prices, and sustained onboard spending collectively enhanced revenue visibility. Carnival reported record second-quarter revenue of US$6.7 billion, while customer deposits reached US$9.0 billion. Geopolitical conflict, higher fuel costs, and itinerary disruptions nevertheless prompted the company to lower its guidance, underscoring that robust bookings do not necessarily convert proportionately into earnings growth.
The gambling sector, meanwhile, exhibited a pattern of recovering visitor flows alongside increasingly pronounced regional divergence. MGM’s first-quarter revenue increased by 4% year over year, with Macau and digital operations delivering comparatively stronger performance, signalling continued resilience in tourism and premium entertainment demand. The segment’s contribution, however, remained uneven, as differences in spending intensity, regulatory conditions, and capital requirements across markets placed greater emphasis on operating efficiency and customer mix.
By comparison, the fine dining sector delivered a relatively stable performance. Demand associated with high-end social occasions and corporate entertaining continued to provide a degree of support, while divergent traffic trends, intensifying promotional competition, and sustained pressure from labour, food, and rental costs limited margin expansion. Sector returns therefore depended increasingly on brand premium, menu productivity, and store-portfolio optimization rather than on straightforward network growth.
The fine art sector, for its part, shifted from a persistent drag toward a limited recovery. The Art Basel and UBS report released during the first half of 2026 showed that global art sales increased by 4% in 2025 to US$59.6 billion, supported by an improvement in auction activity and high-end transactions. Market liquidity and transaction volumes nevertheless remained concentrated in higher-quality works, leaving the segment highly sensitive to wealth effects and shifts in risk appetite.
[For more insights, please download the full report]


Review & Prospect

Review & Prospect

Luxury’s Refined Path Through Turbulence

Financial Discipline with Strategic Realignment

Review & Prospect
Prosperity Unabated,
Refinement Sustains the Premium:
26H1 Review & Prospect
Sep 16, 2026
Examining widening performance divergence as luxury enters a new phase of value validation, with pricing power increasingly anchored in earnings quality and operational resilience.
[2026H1 in a Nutshell]
[2026H2 Outlook]
High-net-worth consumption continued to benefit from global asset appreciation, while aspirational demand among middle-income consumers and broader discretionary spending became increasingly restrained. Currency headwinds, inventory pressure, and intensifying promotional activity further widened the gap between stronger and weaker operators. As a result, the market shifted from assigning premiums to brand narratives toward rewarding demonstrable full-price sell-through, margin resilience, and cash-flow delivery.
Within this environment, more rigorous valuation scrutiny at the primary-index level, K-shaped divergence across the secondary indices, and the increasing convergence of stock-level pricing around operating evidence defined the sector’s central evolution during the first half of 2026.
More specifically, after a brief recovery at the beginning of the year, the market applied a materially higher threshold to earnings certainty across the luxury sector. Although the primary index initially advanced before reversing and ultimately closing lower, this did not signal a broad deterioration in fundamentals. Rather, the limited improvement in operating performance proved insufficient to sustain a higher valuation range. Investors became less willing to price in recovery expectations indiscriminately, shifting their focus toward current earnings quality, cash conversion, and the credibility and timing of delivery.
At the secondary-index level, relative performance was shaped by the interaction of customer resilience and business-model visibility. Within Core Luxe, the jewelry and watches sector outperformed the fashion and leather goods sector: jewelry benefited from its value-retention attributes and gifting demand, while the fashion and leather goods sector remained constrained by weaker traffic, inventory pressure, and creative transitions. Ultra Luxe, by contrast, demonstrated stronger defensive characteristics through long-duration order books, customization revenue, and structurally constrained supply.
Mass Luxe remained the most exposed to middle-income purchasing power and channel inventories. Beauty and fragrance sustained growth through repeat purchasing and product innovation, but this resilience was insufficient to offset spirits destocking and softer demand across home-related categories. Experiential Luxe, meanwhile, was supported by cruises, hospitality, gaming, and art transactions, once again highlighting the structural resilience of experience-led expenditure.
As divergence intensified, capital allocation became increasingly concentrated among a narrower group of assets offering verifiable resilience. Leading Performers outperformed through earnings recovery and the release of operating leverage. Mid-tier Stocks names preserved valuation support through disciplined full-price distribution, dependable cash generation, and shareholder returns. Tail-end Stocks, weaker demand, inventory normalization, and elevated investment requirements combined to create a negative feedback loop of slowing revenue, mounting margin pressure, and continued valuation compression.
Within this framework, Leading Performers such as Shinsegae, Seiko, Movado, Citizen Watch, and Sa Sa International emerged as clear market standouts and became focal points for capital allocation.
From a macro perspective, continued gains across global equity markets sustained the wealth effect and provided tangible support to high-net-worth consumption, while the recovery in cross-border mobility reinforced travel retail and experience-led spending. These tailwinds were offset by the combined effects of conflict in the Middle East, higher oil prices, rising European interest rates, and adverse currency translation. At the same time, subdued domestic demand in China further widened performance dispersion across regions and customer segments.
Taken together, the macro environment did not generate a uniform sector-wide uplift. Instead, the interaction of wealth effects, interest rates, currency movements, and geopolitical risk reshaped the industry’s relative performance hierarchy, leaving the luxury sector in a regime defined by underlying resilience but increasingly pronounced divergence.
Looking ahead to the second half of 2026, the dominant index narrative is expected to shift from valuation validation toward earnings delivery. With macro headwinds yet to recede fully and operating performance continuing to diverge, capital markets are likely to become less tolerant of traffic-recovery narratives and brand storytelling unsupported by financial evidence. Valuation anchors should therefore become more firmly tied to full-price sell-through, margin resilience, free-cash-flow generation, and execution credibility.
Accordingly, further index upside is more likely to arise from the stabilization and selective expansion of valuation ranges supported by demonstrable operating progress, rather than from a broad-based return to historical multiples. Companies capable of converting traffic consistently into earnings and cash flow are therefore better positioned to become the principal contributors to index resilience.
Against a backdrop of persistent currency volatility and a higher threshold for earnings delivery, divergence across the secondary indices is likely to remain pronounced. Within Core Luxe, a recovery in fashion and leather goods—supported by continued resilience in jewelry and established iconic products—could create the conditions for renewed leadership. Ultra Luxe, by contrast, should retain its defensive role and strategic allocation appeal through long-duration order books, structurally scarce supply, and comparatively low price sensitivity.
For Mass Luxe, the key variables remain the cyclical progression of its core categories. Completion of channel destocking in spirits, combined with sustained new-product productivity in beauty and fragrance, could move the segment from stabilization toward gradual recovery. Experiential Luxe should remain comparatively more predictable, supported by resilient demand across premium travel, hospitality, and cruises. Its performance, however, will depend increasingly on the balance among capacity expansion, booking visibility, unit revenue, capital intensity, and cost discipline.
Investor attention is expected to remain highly concentrated, with capital allocation tilting further toward assets offering verifiable certainty. High-resilience names such as Richemont, Mercedes-Benz, Embraer, L’Oréal, and Hilton should remain well positioned to command valuation premiums through strong brand and order-book barriers, disciplined full-price distribution, robust balance sheets, and dependable cash returns.
For Experience-Refined Value Picks including Pandora, Ralph Lauren, LVMH, Royal Caribbean, and Hyatt, the valuation case will depend on whether product innovation, occasion-based engagement, and customer connectivity can be translated into repeatable growth engines. Critical evidence will include the contribution of new products to average transaction value and repeat purchasing, improvements in channel and booking efficiency, and the conversion of organizational execution, resource allocation, and expansion investment into earnings and free cash flow. Collectively, these factors will determine whether individual names can progress from cyclical recovery toward structural growth.
By comparison, less differentiated brands and companies with weaker channel control are likely to remain exposed to elevated operating friction. Limited demand resilience, combined with inventory pressure, discounting, and high fixed costs, may continue to constrain revenue quality and limit the pace of margin recovery.
At the macro level, oil prices, European interest rates, currency movements, renminbi-denominated wealth effects, and Chinese outbound travel will remain the principal variables shaping the sector’s underlying demand foundation. An easing of geopolitical and energy pressures, together with stable major asset prices, could provide incremental support to high-end consumption and sector valuations. Uneven global growth, subdued domestic demand in China, and recurring trade-policy uncertainty will nevertheless continue to elevate the sector’s volatility profile.
As cross-border consumption and global distribution networks continue to recover, macro sensitivity will become increasingly concentrated in currency pass-through and shifts in regional supply-demand conditions. Brands will therefore need to manage global price architecture, regional product allocation, and inventory cadence dynamically, while simultaneously optimizing supply chains, production planning, and capital deployment. These capabilities will be essential to absorbing external shocks, protecting gross-margin structures, and sustaining long-term brand momentum.

Shanghai
11/F · WSH Building
POLY GREENLAND PLAZA
198 Jingzhou Road
Shanghai PRC · 200082
London
OFFICE SUITE 29A · 3/F
23 Wharf Street
London England · SE8 3GG
Hongkong
9/F · Tower A
NEW MANDARIN PLAZA
14 Science Museum Road
Hongkong SAR · 999077