

Momentum Diverges; Realization Ascends as the New Governing Order:
26H1 Review & Prospect
Momentum Diverges; Realization Ascends as the New Governing Order:
26H1 Review & Prospect


Navigating industry transformation and value realignment, reviewing H1 2026 performance and evolving earnings dynamics across future mobility, while identifying value shifts and structural opportunities for the second half of the year.
[2026 H1 in a Nutshell]
• Primary Index: The index closed at 1,446.36 points, down 5.07% for 2026 H1. Gains of 5.53% in upstream and 6.83% in services proved insufficient to offset a 19.92% correction in manufacturing, as industry pricing logic shifted from scale expansion toward earnings realization.
• Secondary Index: Upstream remains supported by resource supply dynamics and an energy-security premium; services have been re-rated on recurring revenue and commercialization visibility. Manufacturing, by contrast, is absorbing a structural "scale discount" under converging pressure from price competition, inventory burden, and capex discipline — the principal drag on the primary index.
• Constituent Stocks: Market preference has moved from breadth of exposure to demonstrated delivery capability. Bellwethers are concentrated in materials, semiconductors, specialty equipment, and intelligent detection. High-value names are anchored in global commercial vehicles, electrification, and integrated energy platforms. Growth names remain centered on OEMs, edge computing, and mobility networks, though increasingly contingent on validated unit economics..
• Macroeconomic Trends: The Middle East conflict is compressing long-duration asset valuations via the oil price–inflation–discount rate channel. China reflects subdued domestic demand, export-led support, and structural upgrading; European electrification demand remains resilient amid rising localization thresholds; North America is rebalancing following subsidy step-down.
• Industry Operations: The industry is moving from a contest of penetration rates to a verification of returns on capital. Volume, share, and exports remain foundational to growth, but price discipline, platform-level cost reduction, software monetization, overseas localization profitability, and free cash flow now jointly determine valuation.
[2026 H2 Outlook]
• Primary Index: Under the base case, the index enters a phase of "structural rotation rather than synchronized ascent," with oil prices and real interest rates continuing to function as the master valve on valuation. Should cost pressures abate, manufacturing retains meaningful recovery elasticity; should the high-cost environment persist, upstream and services should continue to command leadership.
• Secondary Index: The value chain advances into a phase of asynchronous realization, with the locus of value increasingly well-defined. The upstream sector turns on the cost curve and supply discipline; the midstream sector on price order, inventory discipline, and return on unit capital; the downstream sector on per-vehicle utilization, paid mileage, cash burn, and the efficiency of city-by-city replication.
• Constituent Stocks: Capital continues to concentrate around verifiable certainty. High-value companies anchor their base through supply chain leverage, global channel reach, and cash flow buffers, consolidating their dominant positions. Bellwether companies must underwrite re-rating with delivered profitability. Growth companies face the imperative of converting technological advantage into scaled revenue and demonstrable unit economics.
• Macroeconomic Trends: Global demand dynamics will be shaped by the interplay of oil prices and interest rates as the principal determinant of the risk premium. China's automotive price order, European tariff and localization costs, and the post-subsidy demand equilibrium in North America will jointly determine regional profitability; exports continue to furnish incremental upside, though rising compliance burden and capital intensity will accelerate divergence among companies.
• Industry Operations: Competitive advantage continues its shift from product specification and delivery scale toward platform efficiency and full-lifecycle value. Companies capable of reducing R&D and manufacturing complexity, expanding software and services revenue, and establishing a profitable closed loop overseas are best positioned to command a durable premium.
Looking back on the first half of 2026, the PRMC Forward Mobility Index closed at 1,446.36 points, down 5.07% from the start of the year. This correction does not reflect market rejection of the electrification and intelligence trends; rather, it signals a re-examination of the linear assumption that rising penetration necessarily translates into profit expansion across the entire value chain:
First, the macro cycle has elevated discounting pressure. The Middle East conflict is compressing the valuation of long-duration assets via the transmission channel of oil prices, inflation, and interest rate expectations. Concurrently, subdued domestic demand in China, rising localization thresholds in Europe, and subsidy step-down in North America are further differentiating the quality of growth across regions.
Second, the earnings cycle has begun to dominate pricing. New energy vehicles and exports continue to grow, but price competition, inventory burden, and capex constraints have weakened profit transmission at the manufacturing end. The upstream and services indices rose 5.53% and 6.83% respectively, while the manufacturing index declined 19.92% — driving a shift in valuation logic from scale expansion toward earnings realization and return on capital.
Correspondingly, the secondary indices have exhibited value rebalancing along the chain. Upstream is buoyed by resource supply dynamics and an energy-security premium; midstream is absorbing a scale discount amid price competition; downstream commands a relative premium on the strength of recurring revenue, operational efficiency, and commercialization visibility.
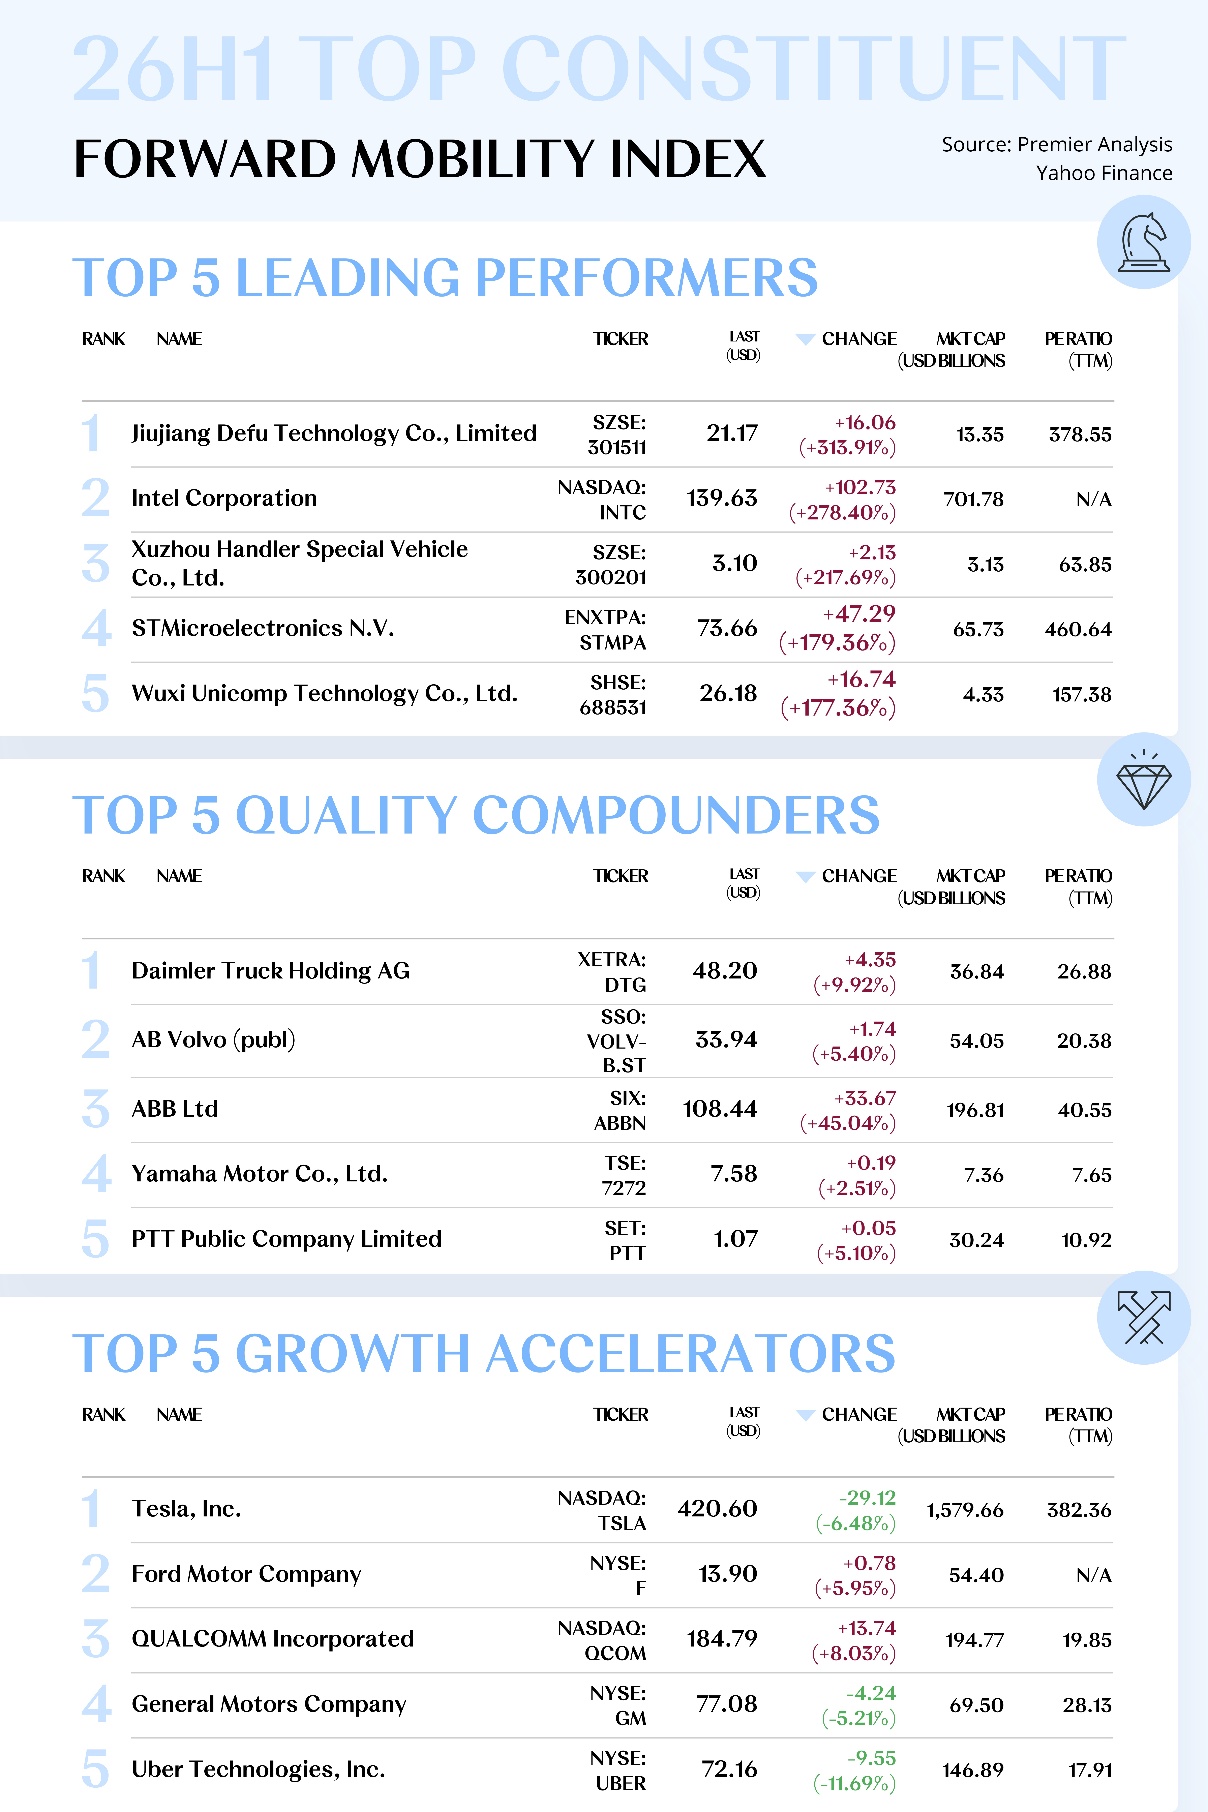
As divergence deepens, the market's screening criteria have shifted from track coverage to delivery density. Investors are increasingly focused on whether companies can convert revenue growth into profit and free cash flow, and whether global channel reach, localized operations, and supply chain control can enhance resilience to volatility. Under this logic, Leading Performers such as Defu Technology, Intel, STMicroelectronics, Nichirei Tech, and AMD emerged as representative beneficiaries of the market's H1 re-rating.
From a macro perspective, corporate divergence has been further amplified by external variables. Energy prices, real interest rates, and regional demand misalignment are shaping the pace of automotive consumption and valuation; meanwhile, tariffs, subsidy adjustments, rules of origin, and localization requirements are redrawing the boundaries of global supply chains — directly reshaping companies' cost curves, product portfolios, and paths to overseas expansion.
At the industry level, the defining inflection of H1 2026 is the transition from a "penetration-rate race" to a "return-on-capital verification" phase. Volume, share, and exports remain the growth chassis, but price discipline, platform-level cost reduction, software monetization, offshore localization profitability, and free cash flow are now jointly determining operating quality and valuation centers.
Looking ahead to 2026 H2, the index may transition from the deep divergence of H1 toward structural rotation. Energy prices and real interest rates remain the master valve on valuation, while trade barriers, industry regulation, and regional policy further shape the risk premium. Market tolerance for forward-looking narrative is declining, and pricing gravity is concentrating on earnings quality, cash flow resilience, and pace of realization.
Accordingly, index upside is more likely to emerge from valuation stability underpinned by earnings certainty than from sentiment-driven broad-based expansion. Companies able to sustain profit and free cash flow through cost, demand, and policy volatility will be the primary source of index resilience.
Rebalancing across the secondary indices will shift from phased divergence to asynchronous realization. Upstream turns on the cost curve and supply discipline; midstream on price order, inventory improvement, and return on unit capital; downstream on per-vehicle utilization, paid mileage, cash burn, and city-by-city replication efficiency — each segment seeking re-rating along its own operating cycle.
Stock-level competition will be further reconfigured. High-value names — ABB, Eaton, Daimler Truck, PTT, and O'Reilly Automotive among them — draw on supply chain leverage, global channel reach, and cash flow buffers to sustain operating stability through volatility, with capital discipline poised to consolidate their positions further.
Growth names — CATL, NVIDIA, Tesla, Uber, and ACV Auctions among them — must convert technological, platform, or network advantage into scaled revenue and demonstrable unit economics. The defining question is no longer conceptual leadership, but whether commercialization pace can match valuation expectations.
Survival pressure on mid- and lower-tier companies will continue to build, as financing costs, price competition, compliance spend, and capex jointly compress cash flow headroom — leaving those without differentiation, cost advantage, or stable funding exposed in the coming consolidation.
From a macro perspective, regional conditions remain divergent: emerging markets retain headroom for motorization; European electrification demand persists amid rising tariffs and localization thresholds; North American demand stays constrained by rates and subsidy adjustment; and Asia's supply chain advantage is evolving from cost efficiency toward industrial coordination and global operational reach.
Industry competition in H2 resembles a low-intensity, long-cycle contest of efficiency. Price competition persists more implicitly, pressuring low-end profitability, while the mid-to-high end contests pricing power around intelligent experience, powertrain efficiency, safety, comfort, and brand — with systemic value outweighing individual specifications.
At the industry level, exports and overseas expansion are being elevated from a volume lever to a hedge against cyclicality and a driver of structural optimization — their value lying not just in capacity utilization, but in building a regional profit closed-loop through local manufacturing, channels, service, and compliance. High-quality globalization is shifting from export scale toward the sustained realization of brand, profit, and organizational capability.
DOWNLOADS

Lite Report (103 pages)

FM SUPPLY CONSTITUENT ZOOM-IN
Core Technology Accelerating Divergence;
Global Delivery Elevating Value Density
The Forward Mobility Supply Index comprises 13 stocks.
Leading Performers
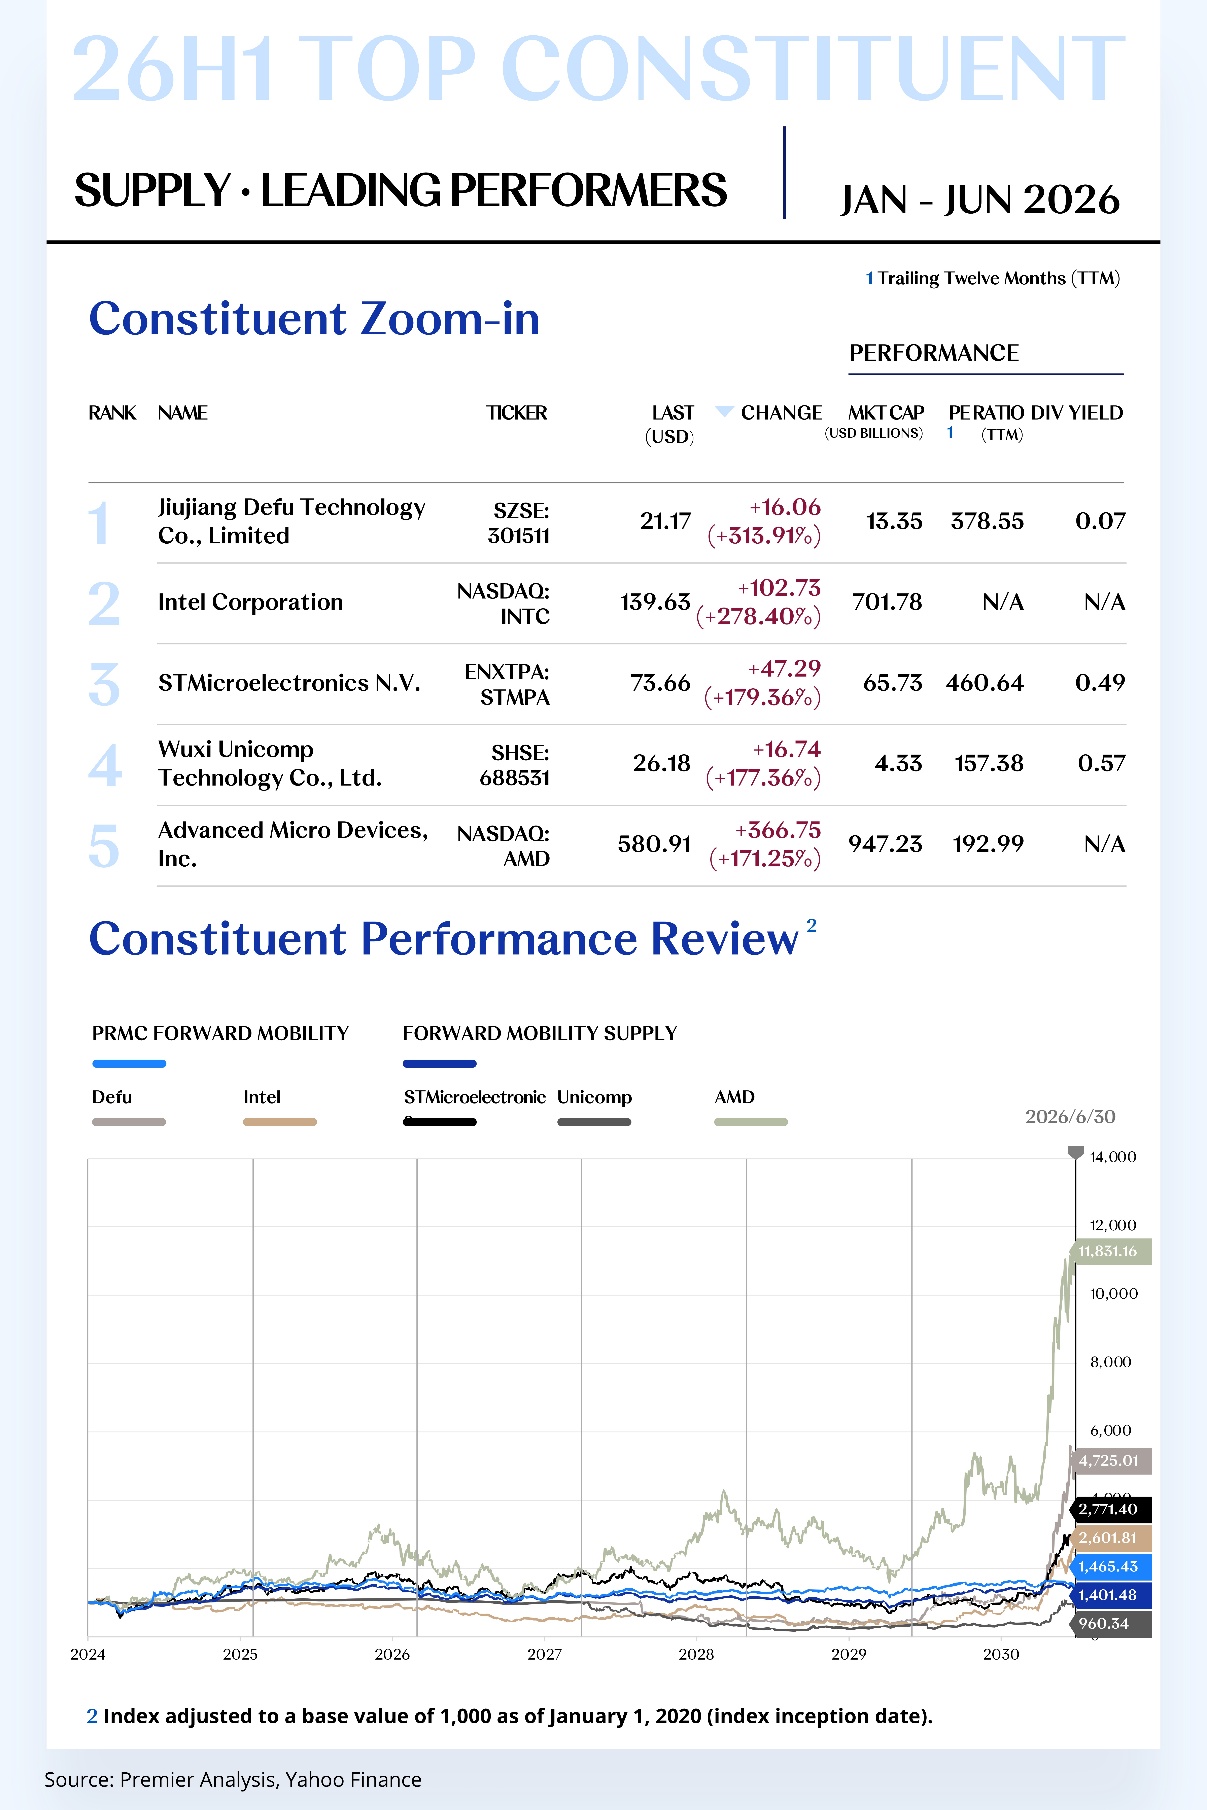
1. Jiujiang Defu Technology Co., Limited (SZSE: 301511)
Jiujiang Defu Technology Co., Limited is a leading Chinese producer of electrolytic copper foil, with a portfolio spanning lithium-battery copper foil and electronic-circuit copper foil. It occupies a critical materials position across power batteries, energy storage and high-end electronics manufacturing. In 2026 H1, the share price rose from US$5.12 to US$21.17, an increase of US$16.06, or 313.91%.
In 2026 Q1, revenue reached RMB4.338 billion, up 73.47% year on year, while net profit attributable to owners of the parent rose 708.90% to RMB147 million. Higher copper-foil volumes, improved capacity utilisation and lower unit costs jointly unlocked operating leverage, moving the business from capacity-led expansion into an efficiency-led recovery phase.
The company continued to advance high-end ultra-thin copper foil, composite copper foil and overseas capacity, while strengthening product qualification and stable supply relationships with leading battery customers. A higher-value product mix should reduce the margin sensitivity to commodity copper prices and industry-wide price competition.
For 2026 H2, the key variables are the contribution from high-end products, overseas customer onboarding and cash-flow quality. If utilisation remains high and the product mix continues to improve, earnings could outpace revenue growth; however, the working-capital and capital-expenditure burden associated with expansion will require disciplined management.
2. Intel Corporation (NASDAQ: INTC)
Intel operates as a global integrated semiconductor platform, spanning client computing, data center, edge computing, and foundry services. Within automotive electronics and smart manufacturing, the company underpins general-purpose compute, control systems, and advanced-node infrastructure. In 2026 H1, Intel's share price rose from USD 36.90 to USD 139.63, a gain of USD 102.73, or 278.4%.
2026 Q1 revenue reached USD 13.6 billion, up 7% year-over-year, with non-GAAP EPS of USD 0.29. The revenue recovery points to improving product-cycle momentum; however, the persistent GAAP loss reflects restructuring charges, manufacturing capital intensity, and foundry-transition costs, underscoring that operational repair remains in a heavy-investment phase.
Through the first half, Intel deepened collaboration with cloud and AI infrastructure customers while advancing progress on process-node roadmaps, advanced packaging, and foundry customer onboarding. The underlying strategic logic is twofold: rebuild technological credibility through manufacturing capability, while using cost discipline to reduce organizational complexity.
Looking to the second half of 2026, the sharp share-price recovery has already priced in strong turnaround expectations. Intel must now substantiate its re-rating with on-schedule product delivery, foundry yield improvement, capital efficiency, and free cash flow generation. Should execution pace fall short, valuation volatility is likely to significantly exceed that of mature semiconductor peers.
[For more insights, please download the full report]
Quality Compounders
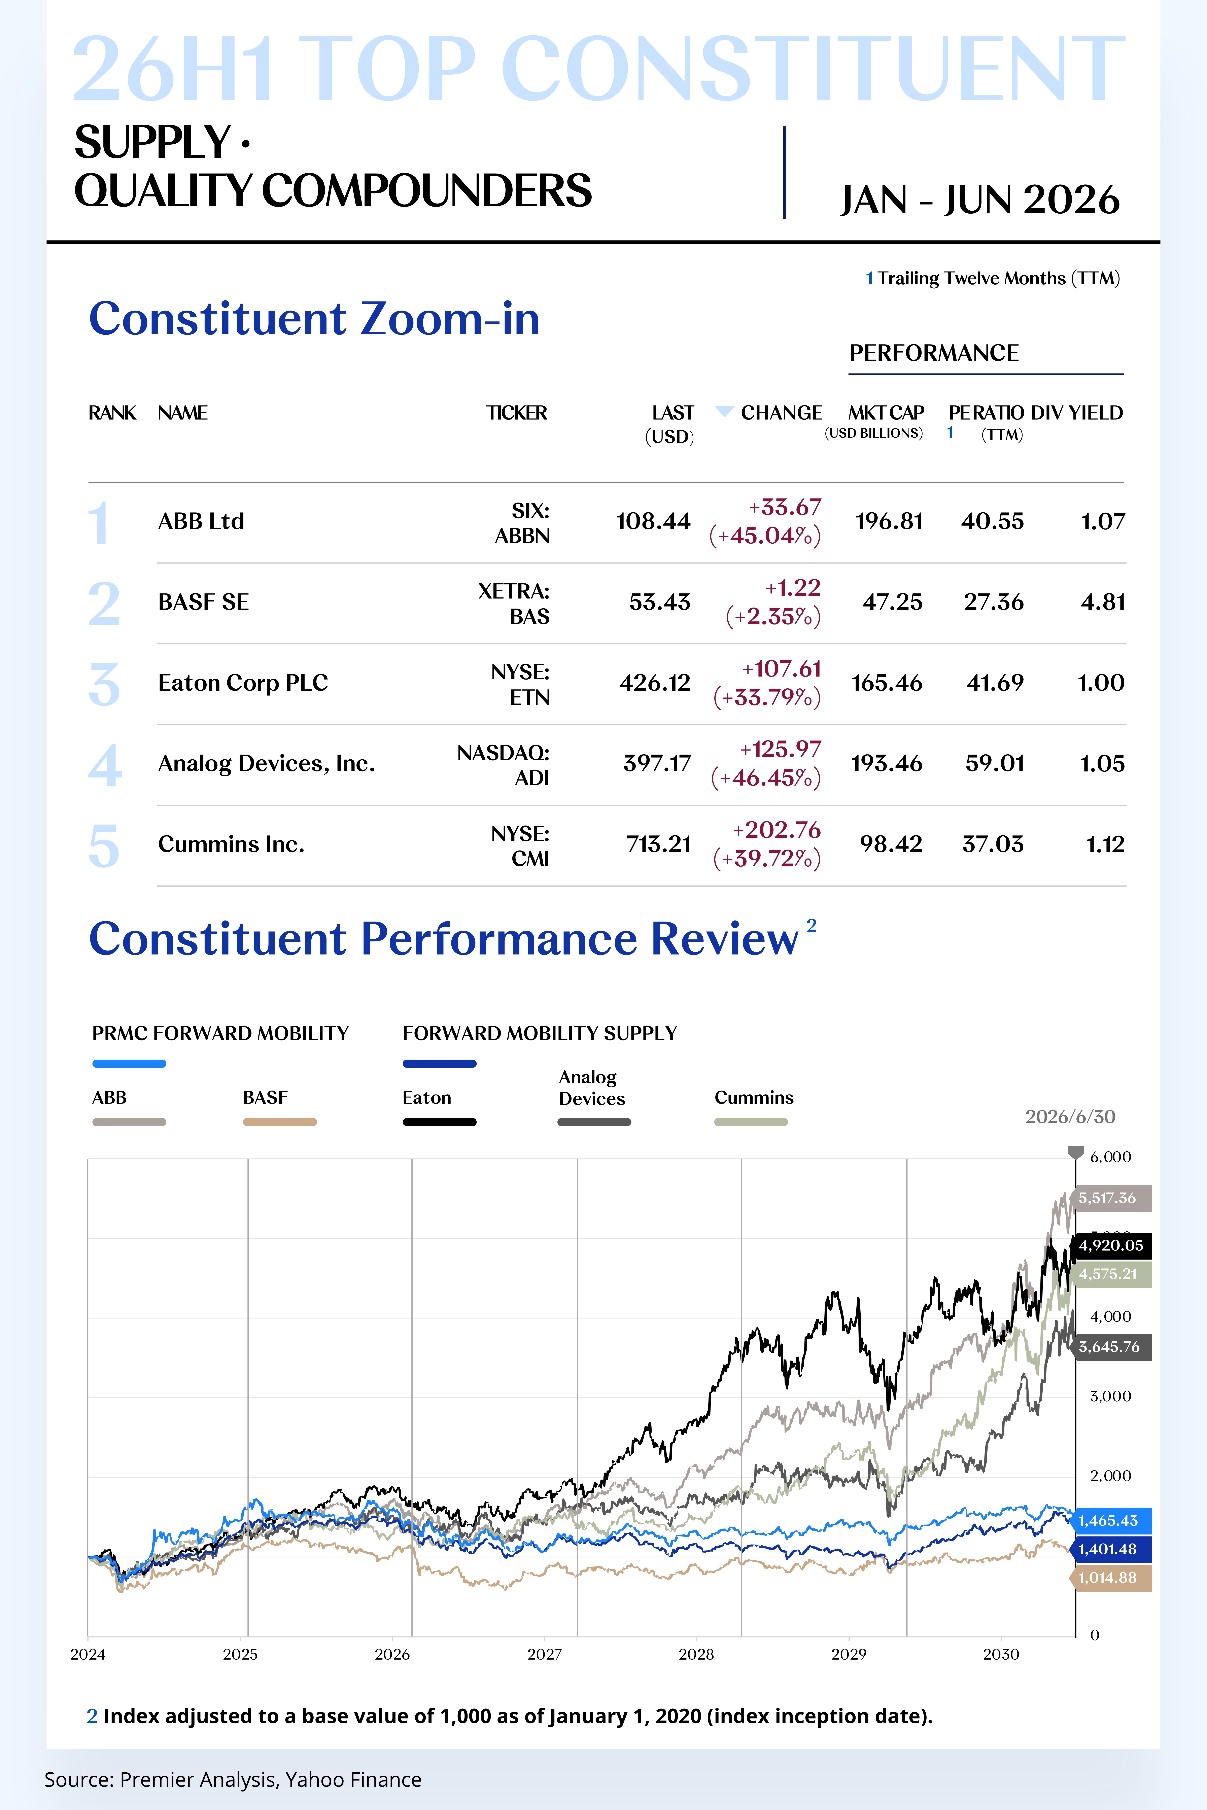
1. ABB Ltd (SIX: ABBN)
ABB Ltd is a global leader in electrification and automation, with capabilities spanning grid connection, industrial drives, process automation and robotics. It is a core beneficiary of investment in the energy transition, data centres and intelligent-manufacturing infrastructure. In 2026 H1, the share price rose from US$74.77 to US$108.44, an increase of US$33.67, or 45.04%.
In 2026 Q1, revenue reached US$8.734 billion, up 18% year on year, while operational EBITA was approximately US$2.049 billion and profitability remained elevated. The simultaneous expansion of orders, revenue and earnings indicates a favourable alignment between electrification demand and project-execution efficiency.
During the half, ABB announced approximately US$200 million of additional grid-related investment in Europe and maintained its dividend and share-repurchase programmes. Capital allocation continues to balance pre-emptive capacity investment, portfolio optimisation and shareholder returns, reflecting the cash-flow discipline of a mature industrial platform.
For 2026 H2, data-centre power demand, distribution-grid upgrades and industrial automation remain the principal medium-term themes. The premium valuation already discounts a high level of growth quality, making further outperformance increasingly dependent on order conversion, margin resilience and the monetisation of newer growth engines such as robotics.
2. BASF SE (Xetra: BAS)
BASF SE is a global diversified chemicals leader, supplying engineering plastics, coatings, catalysts and battery materials across the automotive value chain. Its operating model benefits from cross-regional and cross-product scale synergies. In 2026 H1, the share price rose from US$52.21 to US$53.43, an increase of US$1.22, or 2.35%.
In 2026 Q1, sales were approximately EUR16.02 billion, EBITDA before special items was approximately EUR2.36 billion and net income reached EUR927 million. Profitability remained resilient, although foreign-exchange movements, product pricing and Europe's structural cost base continued to constrain the top line.
The company is further concentrating its portfolio, reducing costs across European production sites and maintaining investment in battery materials and surface technologies. The operating agenda has shifted from scale maximisation towards cash generation and return on capital, with the aim of reducing the fixed-cost burden at the bottom of the cycle.
For 2026 H2, automotive production, energy costs and chemical spreads will determine near-term earnings sensitivity. Medium-term value creation will depend on restructuring delivery and a higher contribution from value-added materials. If the cost baseline continues to fall, BASF should be positioned to capture stronger operating leverage in a moderate demand recovery.
[For more insights, please download the full report]
Growth Accelerators
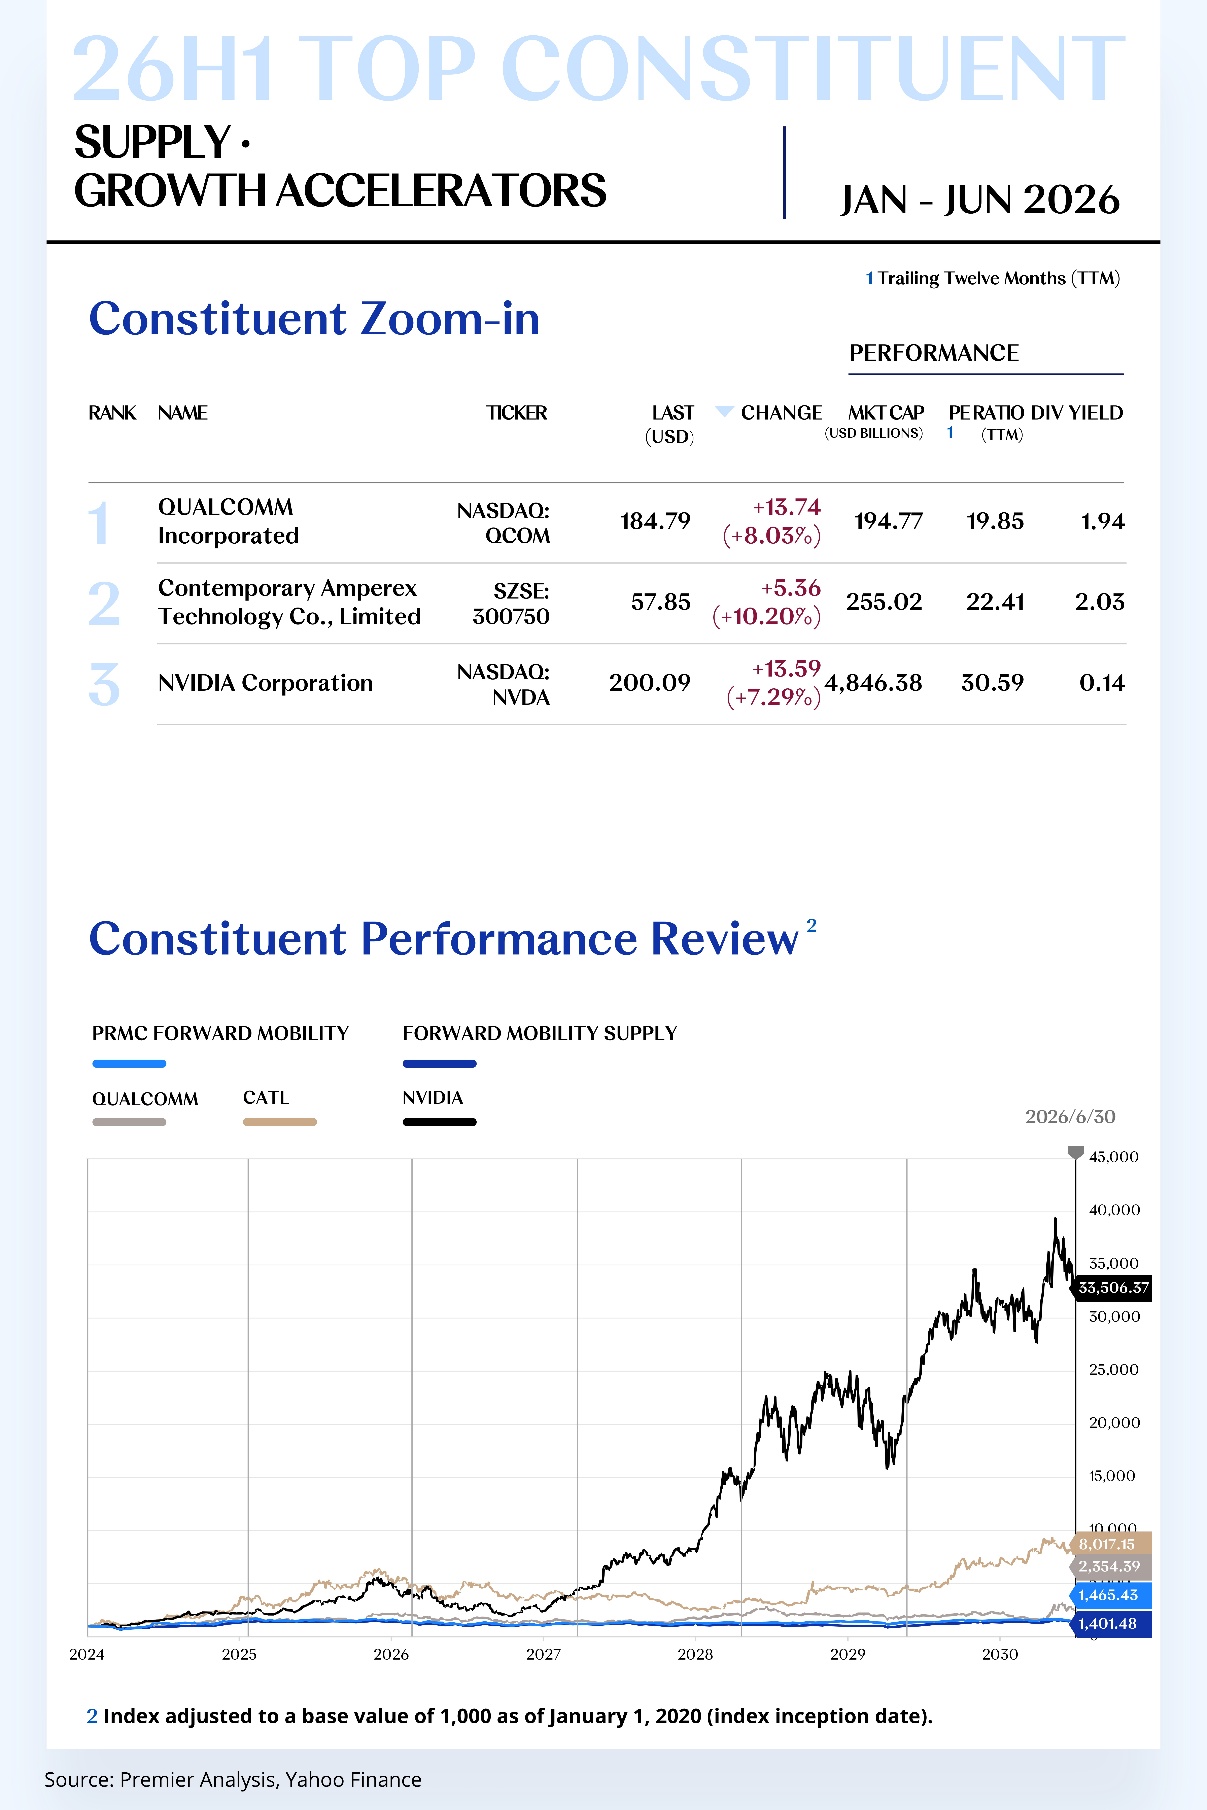
1. QUALCOMM Incorporated (NASDAQ: QCOM)
QUALCOMM Incorporated is a global wireless-communications and edge-computing platform. Through modem, digital-cockpit, vehicle-connectivity and ADAS chipsets, it is evolving from a handset-semiconductor company into a multi-endpoint intelligent-computing provider. In 2026 H1, the share price rose from US$171.05 to US$184.79, an increase of US$13.74, or 8.03%.
In fiscal 2026 Q2, revenue reached US$10.6 billion, while combined automotive and IoT revenue increased 20% year on year and the automotive business set a new record. The core handset franchise continues to fund investment, as automotive design wins convert progressively into more visible, long-duration revenue.
The company is extending its digital-cockpit, assisted-driving, robotics and physical-AI platforms, while increasing share repurchases. The strategic logic is to reuse its low-power computing and connectivity capabilities at the higher-value systems layer across automotive and industrial endpoints.
For 2026 H2, automotive order conversion, edge-AI adoption and the handset cycle will determine the quality of growth. If the non-handset revenue mix continues to rise, Qualcomm's valuation framework could migrate from that of a cyclical chip supplier towards a platform-like cash-flow asset.
2. Contemporary Amperex Technology Co. Limited (SZSE: 300750)
Contemporary Amperex Technology Co. Limited is a global leader in power and energy-storage batteries, supported by end-to-end capabilities across materials systems, manufacturing processes, system integration and a global customer base. It is a central price setter in the cost and performance evolution of new-energy vehicles. In 2026 H1, the share price rose from US$52.49 to US$57.85, an increase of US$5.36, or 10.20%.
In 2026 Q1, revenue reached RMB129.131 billion, up 52.45% year on year; net profit attributable to owners of the parent rose 48.52% to RMB20.738 billion; and operating cash flow reached RMB33.681 billion. The expansion in scale remained well matched by cash generation.
The company continues to advance new battery chemistries, battery-swapping solutions, energy storage and overseas localised manufacturing, using multiple technology platforms to serve different requirements for range, cost and safety. Its globalisation model is moving beyond product exports towards local supply chains and pre-positioned capacity.
For 2026 H2, global electrification and energy-storage demand continue to provide structural growth, although price competition, overseas regulation and returns on capital expenditure warrant close attention. If technology premiums and overseas profitability continue to improve, the company should sustain capital efficiency above the industry average.
[For more insights, please download the full report]
FM MANUFACTURING CONSTITUENT ZOOM-IN
Product Cycles Powering the Recovery;
Manufacturing Efficiency Recalibrating the Profit Center
The Forward Mobility Manufacturing Index comprises 12 stocks.
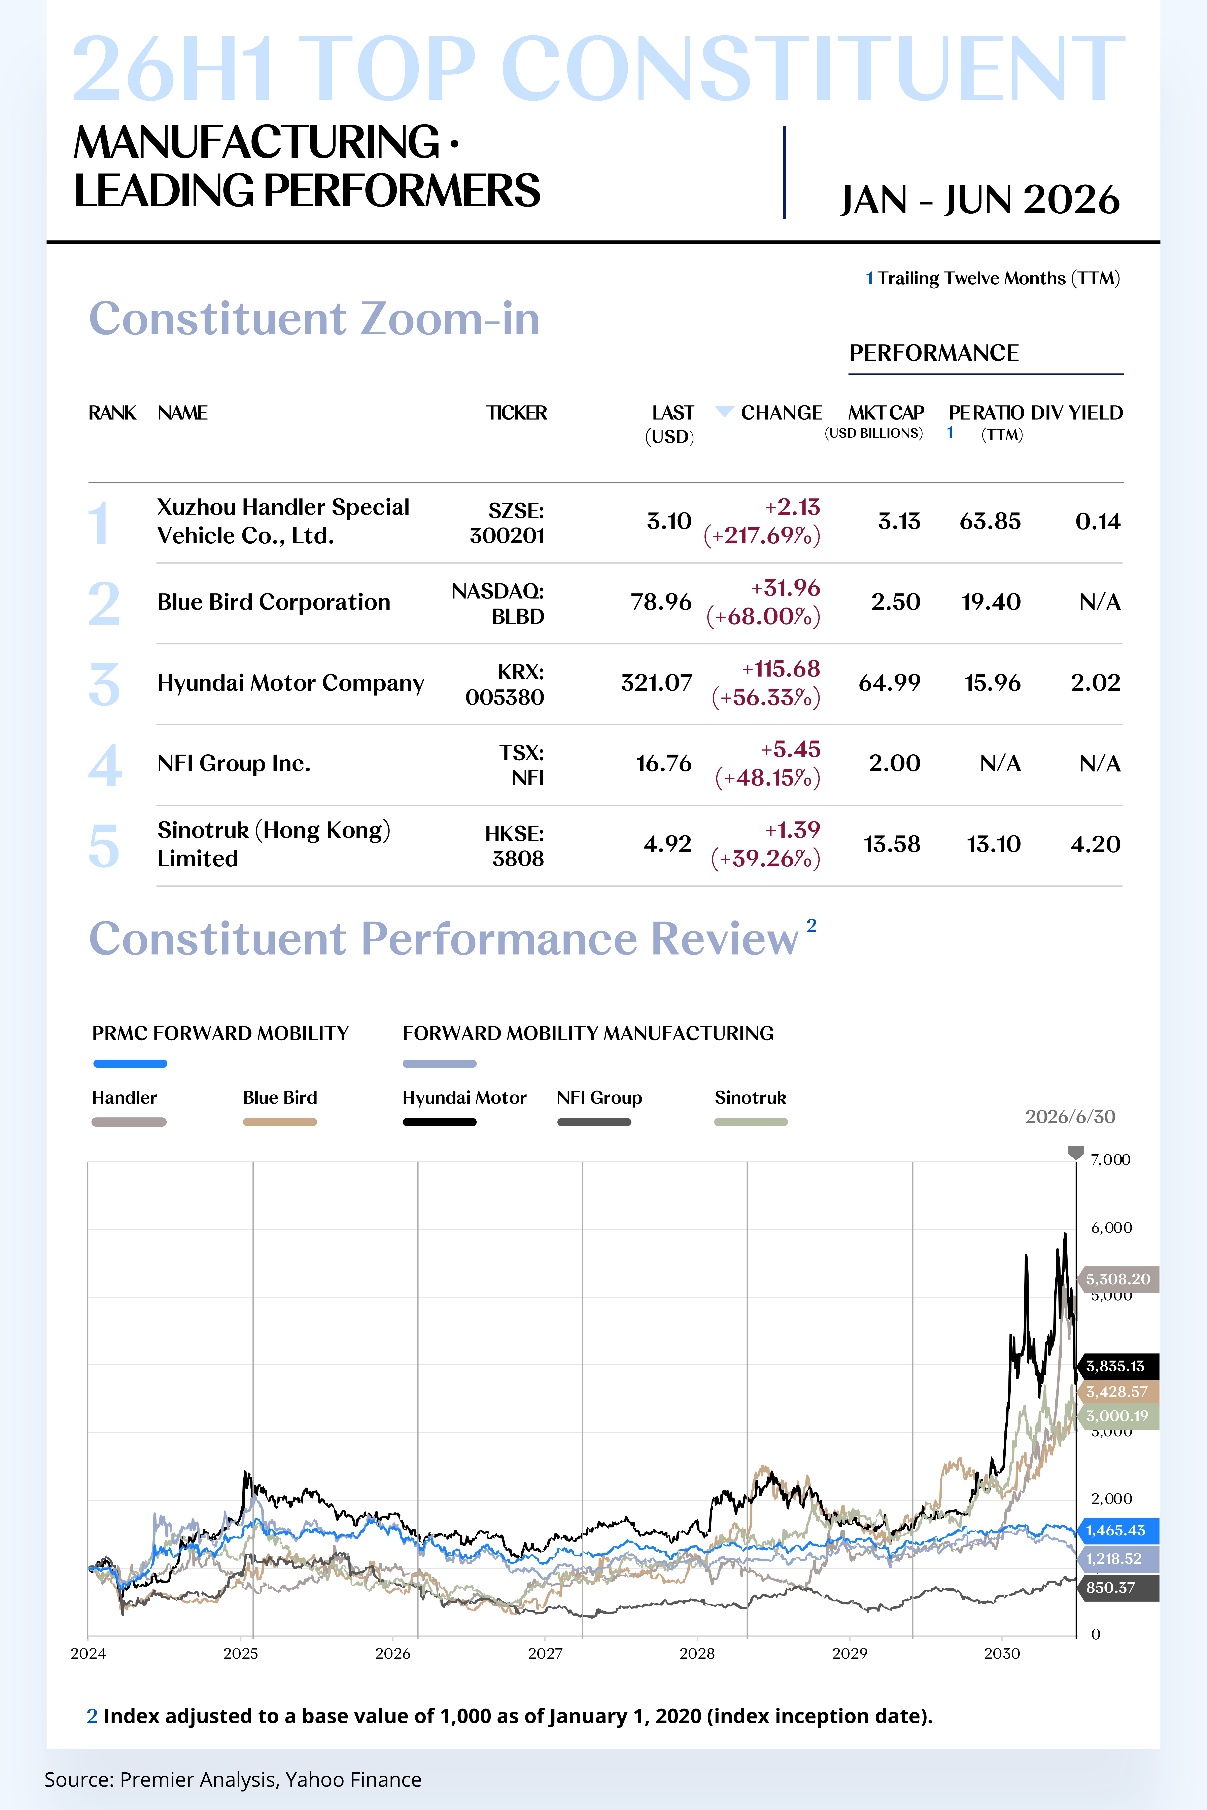
Leading Performers
1. Xuzhou Handler Special Vehicle Co., Ltd. (SZSE: 300201)
Xuzhou Handler Special Vehicle Co., Ltd. is a Chinese manufacturer of aerial-work vehicles, emergency-response equipment and specialised robots. Its products serve high-reliability applications including power-grid support, firefighting and rescue, flood-control operations and urban safety. In 2026 H1, the share price rose from US$0.98 to US$3.10, an increase of US$2.13, or 217.69%.
In 2026 Q1, revenue reached RMB520 million, up 50.48% year on year, while net profit attributable to owners of the parent increased 50.14% to RMB43 million. The parallel improvement in revenue and earnings reflects stronger order delivery, a better product mix and higher operating efficiency.
The company continues to expand its emergency-equipment, specialised-robotics and power-operation platforms, while using business integration to broaden the product perimeter. Its competitive position is evolving from standalone vehicle manufacturing towards a combined proposition of equipment and scenario-specific solutions.
For 2026 H2, growth will depend on order continuity, post-consolidation synergies and collection quality. A higher contribution from margin-accretive emergency-response and robotics products would support further margin expansion; however, pressure on operating cash flow in 1Q highlights the need for tighter working-capital control during the expansion phase.
2. Blue Bird Corporation (NASDAQ: BLBD)
Blue Bird Corporation is a leading North American school-bus manufacturer, with conventional, natural-gas and battery-electric offerings. It benefits from established channels, certification capabilities and scale in the public-transport renewal and clean-school-bus markets. In 2026 H1, the share price rose from US$47.00 to US$78.96, an increase of US$31.96, or 68.00%.
In fiscal 2026 Q2, revenue reached US$352.6 million, net income US$29.0 million and adjusted EBITDA US$50.8 million. The company delivered 2,148 school buses and recorded an adjusted EBITDA margin of approximately 14%, supported by a favourable product mix and improved manufacturing efficiency.
Blue Bird continues to broaden its zero- and low-emission vehicle portfolio while optimising the supply chain, production capacity and aftermarket service. Clean-school-bus orders raise content value per vehicle, while the conventional-powertrain business continues to provide a foundation for cash flow and customer coverage.
For 2026 H2, order conversion will be shaped by policy-funding disbursement, school-district procurement cycles and electric-school-bus penetration. If the production ramp and pricing discipline remain intact, Blue Bird should sustain margins above the industry average through the public-transport replacement cycle.
[For more insights, please download the full report]
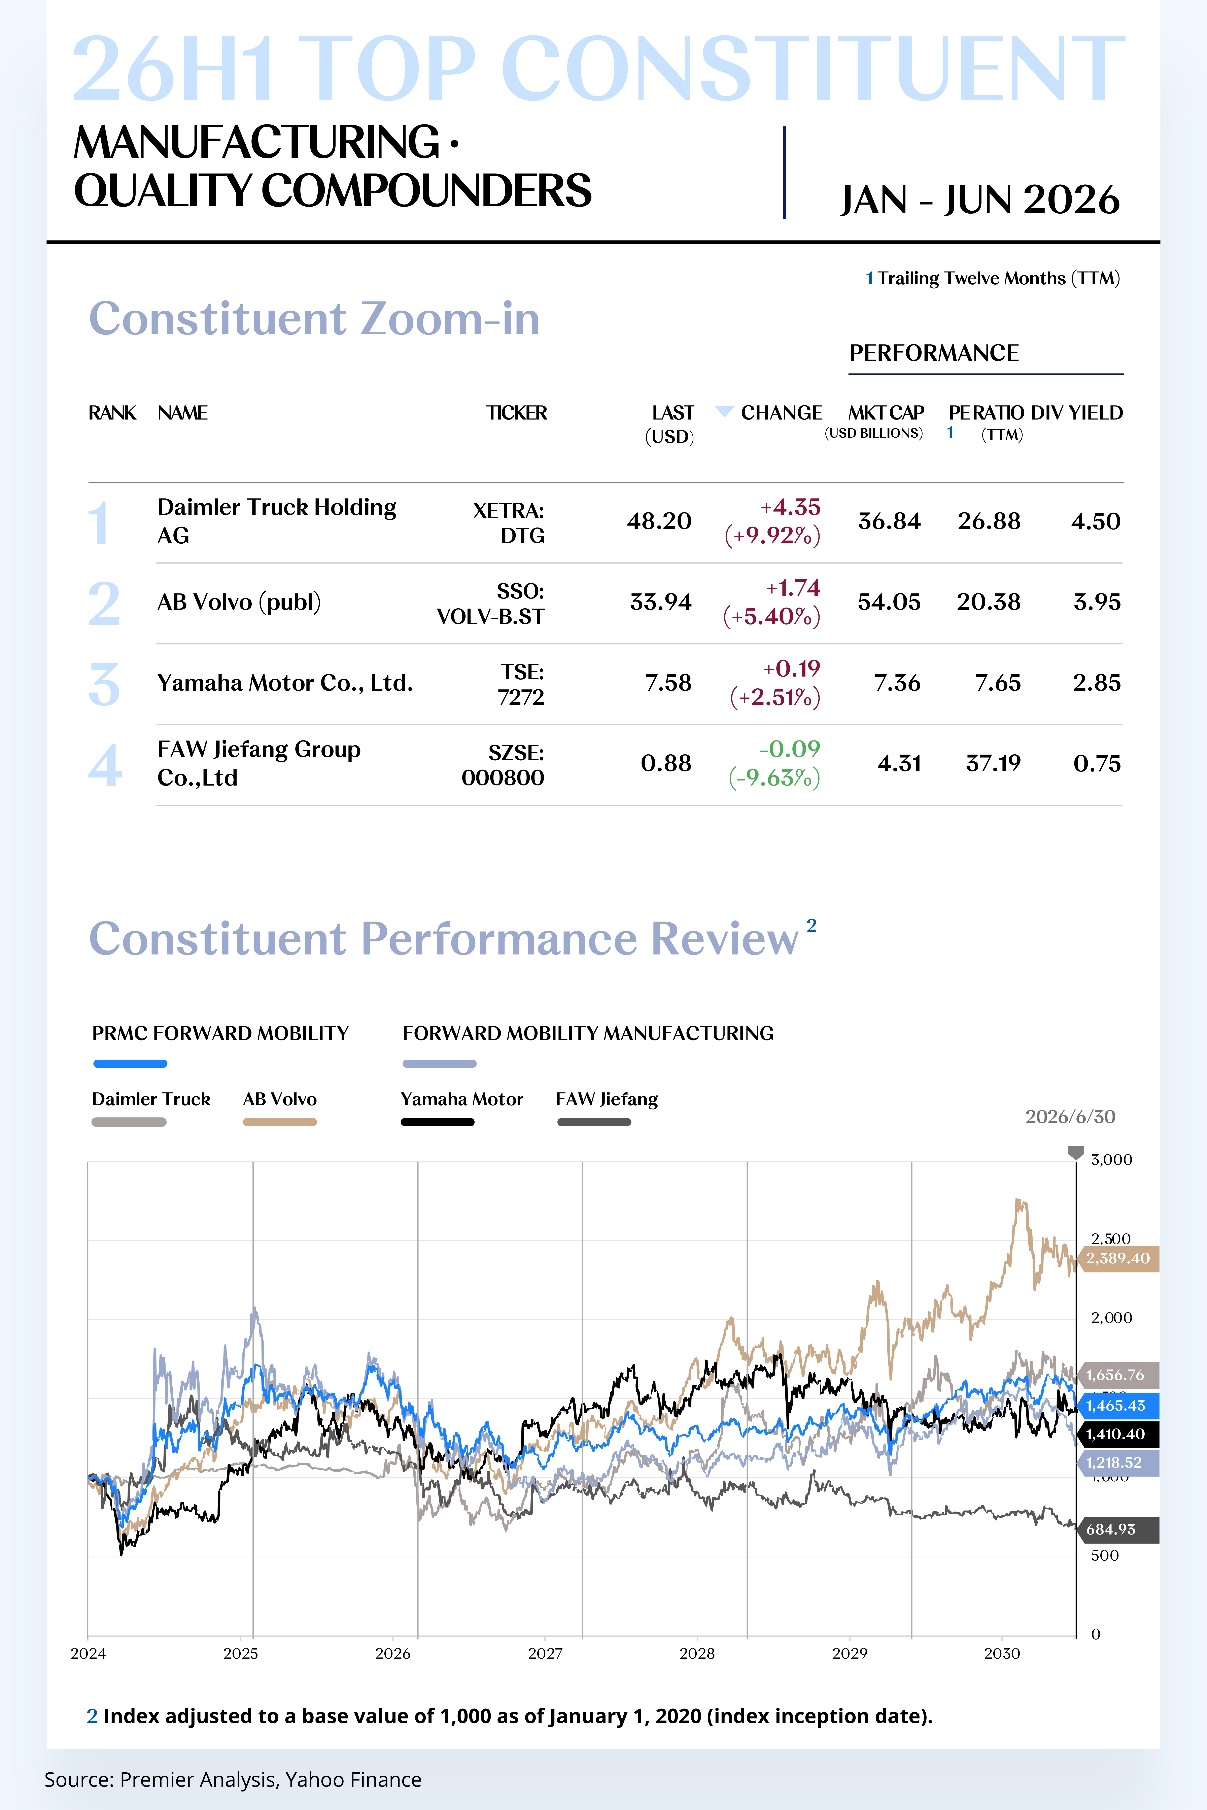
Quality Compounders
1. Daimler Truck Holding AG (Xetra: DTG)
Daimler Truck Holding AG is a global commercial-vehicle leader, with a portfolio spanning Mercedes-Benz Trucks, Freightliner, FUSO and financial services. Its global scale provides exposure to the heavy-truck cycle, fleet-efficiency investment and the transition to zero-emission transport. In 2026 H1, the share price rose from US$43.85 to US$48.20, an increase of US$4.35, or 9.92%.
In 2026 Q1, industrial-business revenue was approximately EUR9.1 billion on sales of 68,849 units. Adjusted EBIT was approximately EUR498 million and net income EUR194 million. Orders remained strong, although lower volumes and the regional mix kept profitability near a cyclical low.
The company continues to advance electric trucks, software services and cost optimisation, while applying stricter capital discipline to manage heavy-truck demand volatility. The balance between earnings from conventional vehicles and investment in zero-emission platforms remains central to the valuation case.
For 2026 H2, fleet replacement in Europe and North America, order conversion and delivery of the cost programme will determine operating performance. A volume recovery alongside resilient pricing would create meaningful earnings leverage, although early-stage zero-emission investment and the macro freight cycle will continue to increase profit volatility.
2. AB Volvo (publ) (Nasdaq Stockholm: VOLV B)
AB Volvo (publ) is a global group spanning trucks, construction equipment, engines and financial services. Its premium commercial-vehicle brands, aftermarket network and flexible manufacturing system provide resilience through the heavy-truck cycle. In 2026 H1, the share price increased from US$32.20 to US$33.94, a gain of US$1.74, or 5.40%.
In 2026 Q1, sales were SEK110.8 billion, down 9% on a reported basis but approximately 2% higher organically. Adjusted operating profit reached SEK12.167 billion, with the margin at 11.0%, slightly above the prior-year level.
The company uses flexible capacity, pricing discipline and the aftermarket business to stabilise earnings, while advancing electric, hydrogen and software-enabled commercial-vehicle solutions. Its capital-markets agenda places greater emphasis on full-cycle returns and asset efficiency than on unit-volume expansion alone.
For 2026 H2, transport demand, orders and inventory will set the near-term pace, while aftermarket and financial services provide downside protection. If electric products scale without diluting returns, Volvo should continue to exhibit the characteristics of a high-quality cyclical compounder.
[For more insights, please download the full report]
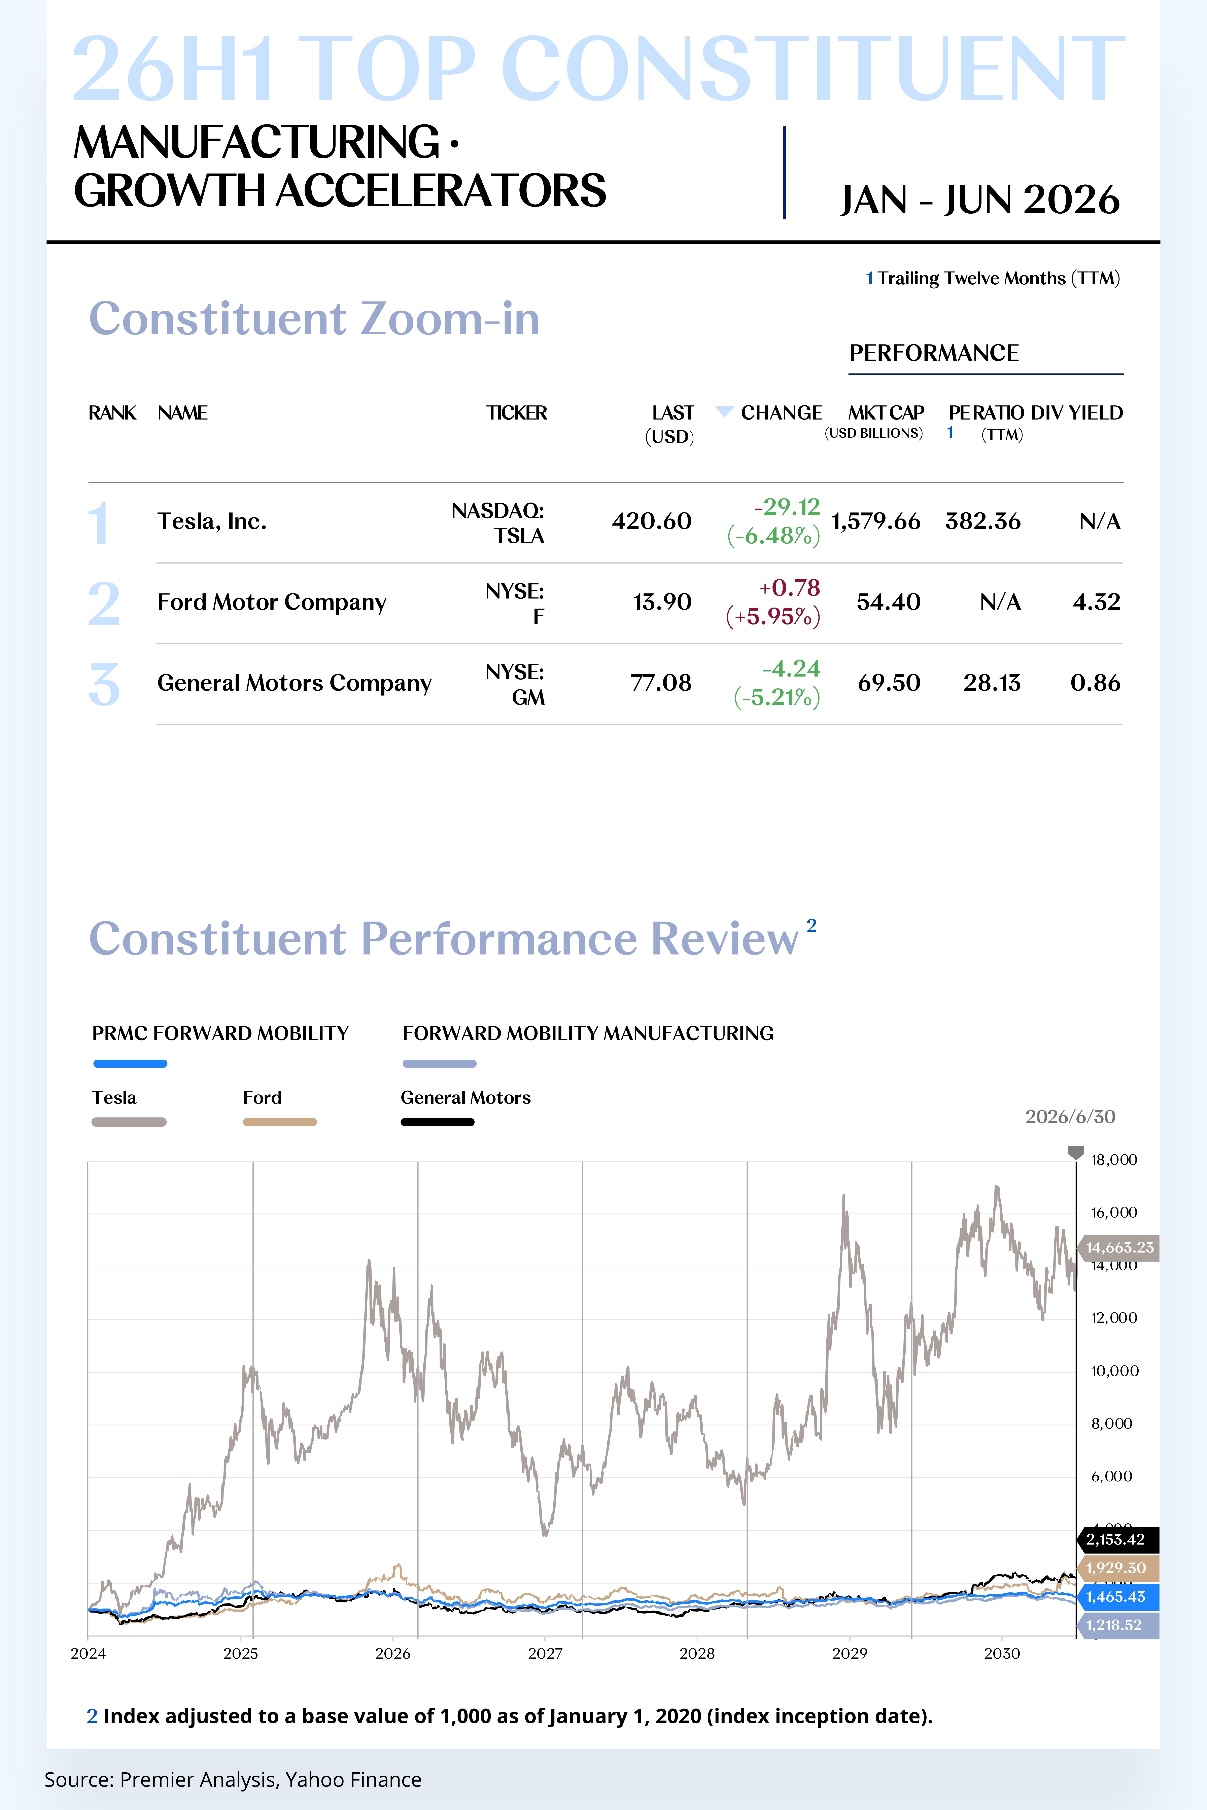
Growth Accelerators
1. Tesla, Inc. (NASDAQ: TSLA)
Tesla, Inc. is a global electric-vehicle, energy-storage and intelligent-driving platform whose valuation framework has progressively expanded beyond vehicle manufacturing to include autonomous driving, robotics and energy networks. In 2026 H1, the share price declined from US$449.72 to US$420.60, a decrease of US$29.12, or 6.48%.
In 2026 Q1, deliveries reached 358,000 vehicles and production 408,400 vehicles. Revenue was approximately US$22.39 billion, up around 16% year on year, while net income was US$477 million. The automotive business recovered, although pricing, incentives and elevated AI investment continued to weigh on profitability.
The company increased investment in Robotaxi, Cybercab, Optimus and compute infrastructure, while continuing to scale the energy-storage business. The strategic perimeter has expanded materially, but the commercialisation timetable and regulatory pathway remain highly uncertain.
For 2026 H2, valuation is likely to be repeatedly repriced around autonomous-driving progress, vehicle demand and capital-expenditure efficiency. The 12.13% share-price decline in the first half reflects renewed market scrutiny of valuation, regulation and competitive intensity. Verifiable AI revenue could provide a new valuation anchor; weaker automotive margins, however, would be difficult to offset fully through long-dated optionality.
2. Ford Motor Company (NYSE: F)
Ford Motor Company is a global automotive group that combines the strengths of Ford Pro, pickup trucks and commercial vehicles across internal-combustion, hybrid, electric and fleet-software offerings. In 2026 H1, the share price rose from US$13.12 to US$13.90, an increase of US$0.78, or 5.95%.
In 2026 Q1, revenue reached US$43.3 billion, net income US$2.5 billion, adjusted EBIT US$3.5 billion and operating cash flow US$1.3 billion. Ford Pro surpassed 865,000 paid software subscriptions, further increasing the contribution from service-based revenue.
The company continues to reduce electric-vehicle losses, expand hybrid and high-margin model supply, and integrate fleet connectivity, financing and aftermarket services into lifetime customer economics. Capital allocation has clearly shifted from single-path expansion towards return-based portfolio management.
For 2026 H2, North American pricing, tariffs and electric-vehicle costs are the principal variables. Ford Pro's high-retention cash flows should provide a buffer. If quality costs and new-energy losses continue to decline, the valuation could begin to migrate from low-return manufacturing towards an integrated fleet-services model.
[For more insights, please download the full report]

AUTO SERVICE CONSTITUENT ZOOM-IN
Freight Demand on a Gradual Uptrend;
Asset-Light Networks Amplifying Profit Elasticity
The Forward Mobility Service Index comprises 12 stocks.
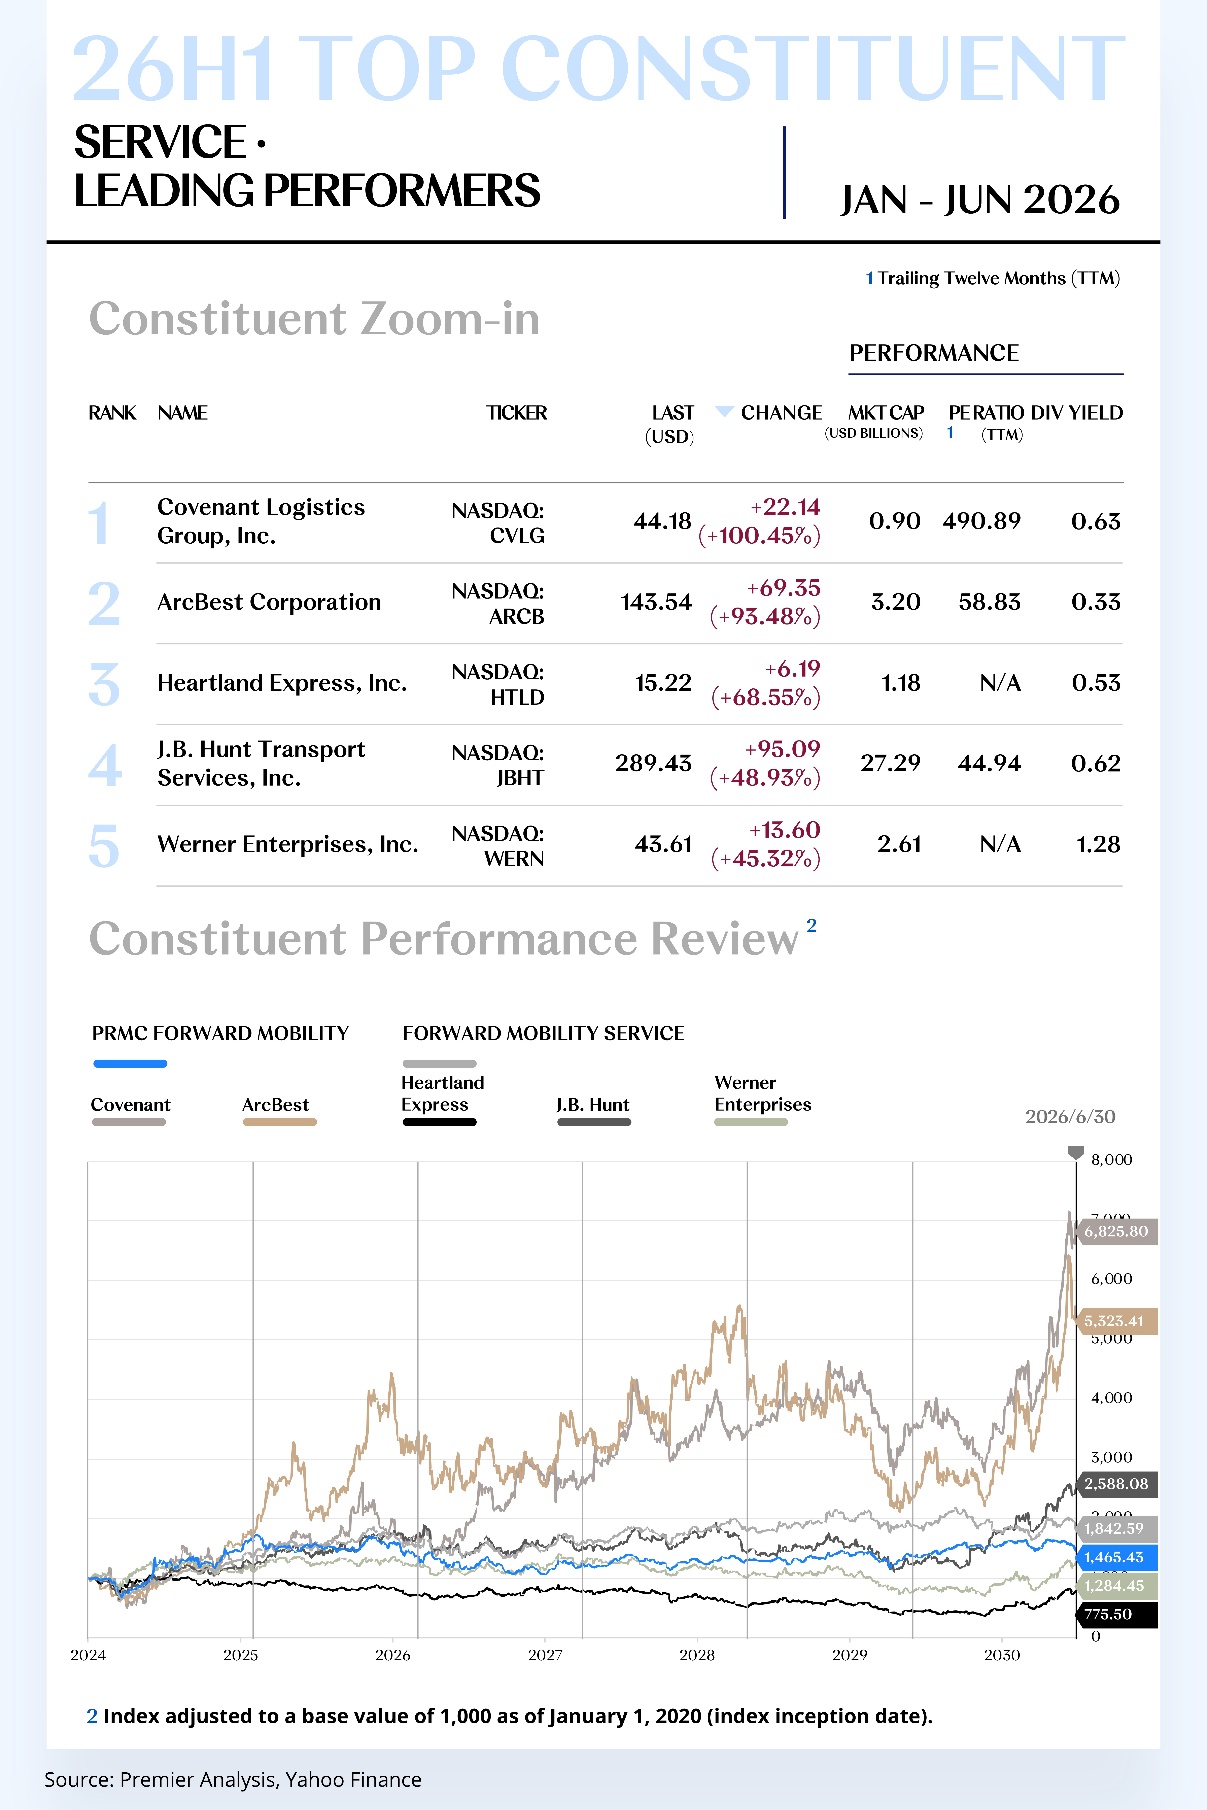
Leading Performers
1. Covenant Logistics Group, Inc. (NYSE: CVLG)
Covenant Logistics Group, Inc. is a US transportation and supply-chain services provider spanning expedited freight, dedicated transportation, warehousing and asset-light transportation management. The portfolio balances owned fleet capacity with service-based revenue streams. In 2026 H1, the share price rose from US$22.04 to US$44.18, an increase of US$22.14, or 100.45%.
In 2026 Q1, total revenue reached US$307.2 million, up 14% year on year, with net income of US$4.42 million and adjusted earnings per share of US$0.26. Severe winter weather and fuel costs weighed on profitability, while transportation-management and dedicated-transport revenue continued to expand.
The company completed the acquisition of a freight-brokerage business with approximately US$130 million in annual revenue, now operating as Star Logistics. At the same time, it exited lower-return customers and reduced underperforming fleet capacity, raising the strategic priority of asset-light revenue and free-cash-flow generation.
For 2026 H2, a sustained recovery in contracted rates and freight volumes would unlock operating leverage. The transition from a cyclical recovery trade towards a quality rerating will depend on acquisition synergies and the effective transmission of lower capital expenditure, deleveraging and shareholder returns.
2. ArcBest Corporation (NASDAQ: ARCB)
ArcBest Corporation is a US multimodal transportation and integrated-logistics platform, with core capabilities across less-than-truckload freight, truck brokerage, warehousing and supply-chain solutions. Its model combines network assets with asset-light service capacity. In 2026 H1, the share price rose from US$74.19 to US$143.54, an increase of US$69.35, or 93.48%.
In 2026 Q1, revenue reached US$998.8 million, compared with US$967.1 million in the prior-year period. The company recorded a GAAP net loss of US$1.0 million and non-GAAP net income of US$7.2 million. Revenue recovered, but network utilisation and fixed-cost absorption continued to constrain profitability.
ArcBest is using dynamic pricing, network optimisation and its technology platform to improve freight matching, while moving customers from single-service procurement towards broader supply-chain relationships. Asset-light services extend customer reach, while the less-than-truckload network provides a differentiated service barrier.
For 2026 H2, improving freight demand and LTL pricing should expand earnings leverage. If cost control and network density improve together, ArcBest has meaningful recovery potential; if not, the fixed-cost structure will keep profitability highly sensitive to changes in volume.
[For more insights, please download the full report]
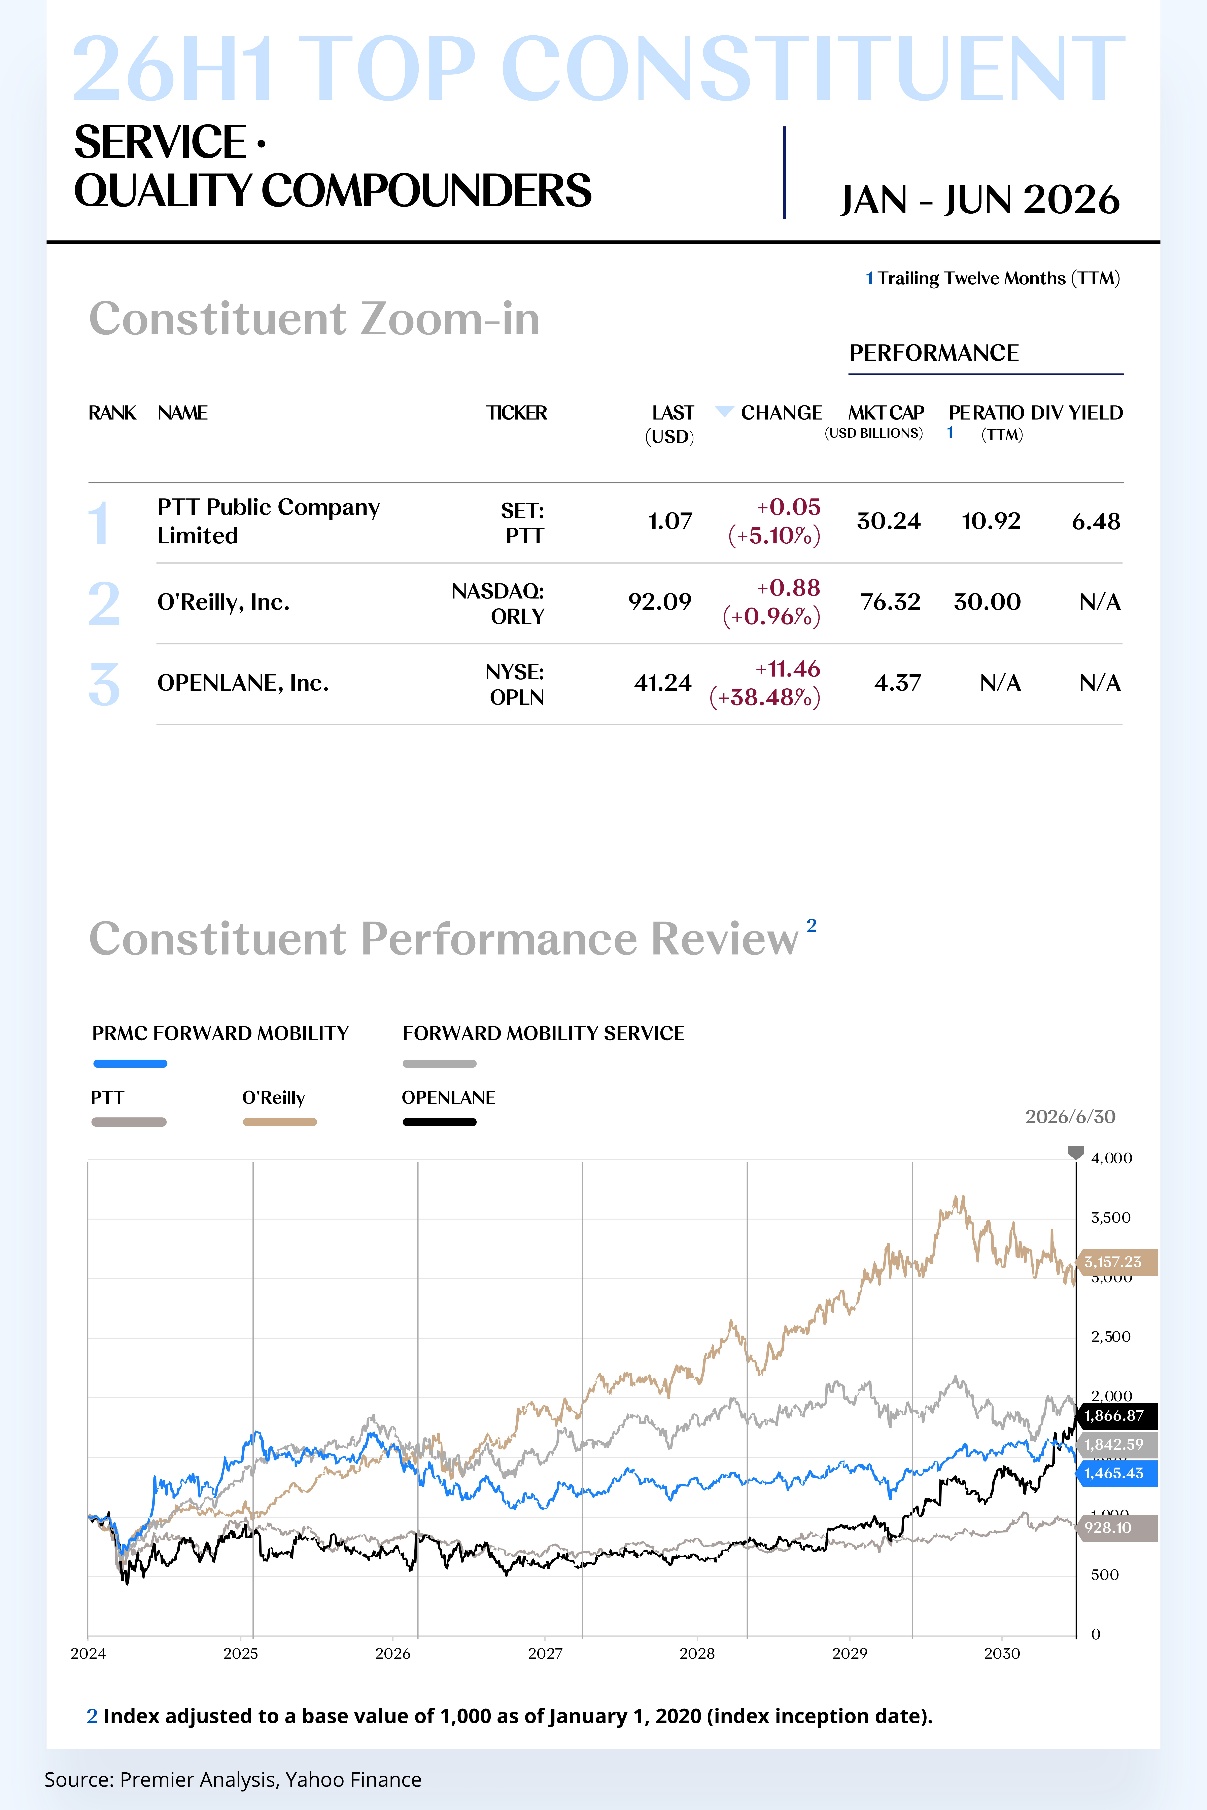
Quality Compounders
1. PTT Public Company Limited (SET: PTT)
PTT Public Company Limited is an integrated Thai energy group with operations across oil and gas, refining, petrochemicals, power and retail. It holds infrastructure and distribution advantages across Southeast Asia's transport-energy and industrial systems. In 2026 H1, the share price rose from US$1.02 to US$1.07, an increase of US$0.05, or 5.10%.
In 2026 Q1, sales were approximately THB718.7 billion, up 2.6% year on year; net profit increased 10.4% to approximately THB25.7 billion; and EBITDA rose by around 23%. The integrated portfolio continued to offset volatility in individual commodity markets.
PTT is advancing its electric-vehicle ecosystem, charging and battery-swapping infrastructure, clean energy and non-oil businesses, while reinforcing cash returns from conventional energy assets. The transition strategy emphasises gradual migration through existing networks rather than aggressive asset divestment.
For 2026 H2, oil prices, refining margins and Thai demand will shape near-term profitability, while returns from new-energy assets will determine the longer-term valuation. A sound balance sheet and dividend capacity provide downside protection, but transition investments still need to demonstrate capital efficiency.
2. O'Reilly Automotive, Inc. (NASDAQ: ORLY)
O'Reilly Automotive, Inc. is a leading US automotive-parts retailer. Its dense store network, rapid distribution and professional-customer service model position it to benefit from an ageing vehicle fleet and the structural substitution of vehicle repair for new-vehicle purchases. In 2026 H1, the share price rose from US$91.21 to US$92.09, an increase of US$0.88, or 0.96%.
In 2026 Q1, comparable-store sales increased 8.1%, net income reached US$604 million, split-adjusted earnings per share rose by approximately 16% year on year and operating cash flow was approximately US$1.0 billion. High inventory turns and pricing power continued to support earnings compounding.
The company continues to expand stores, distribution hubs and coverage of professional repair customers, while using inventory algorithms to improve parts availability. Its competitive moat lies less in any individual product than in network density and immediate fulfilment capability.
For 2026 H2, the size and average age of the vehicle fleet provide structural demand support. The premium valuation requires stable comparable-sales growth and returns on capital. Consumer pressure could delay maintenance and moderate near-term growth, although the network advantage remains defensive.
[For more insights, please download the full report]
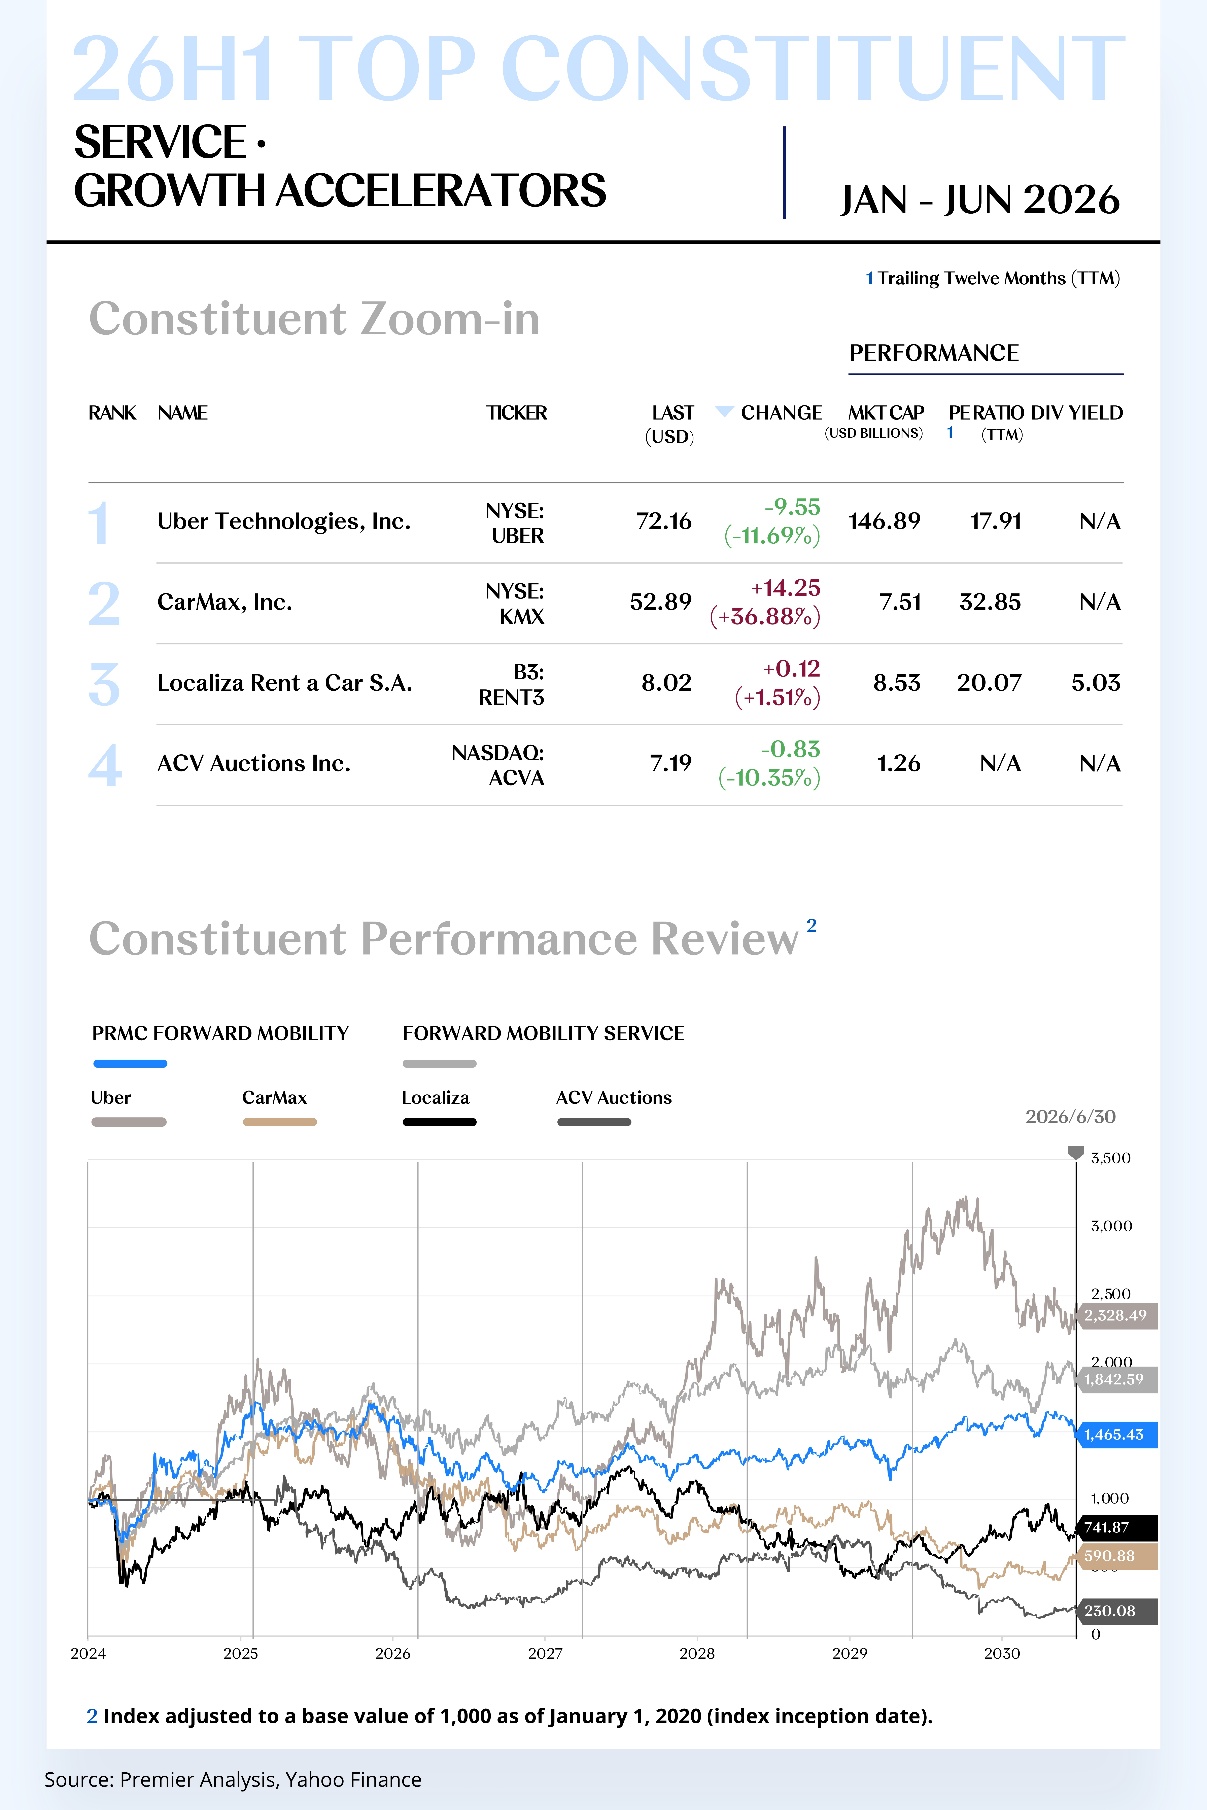
Growth Accelerators
1. Uber Technologies, Inc. (NYSE: UBER)
Uber Technologies, Inc. is a global mobility, delivery and local-services platform. Its two-sided network, payments infrastructure and dispatch algorithms provide scale advantages, while autonomous-vehicle partnerships broaden the future supply of mobility capacity. In 2026 H1, the share price declined from US$81.71 to US$72.16, a decrease of US$9.55, or 11.69%.
In 2026 Q1, trips increased 20% year on year to 3.6 billion, gross bookings rose 25% to US$53.7 billion and revenue increased 14% to US$13.2 billion. User frequency and cross-platform engagement remained strong.
The company continues to expand autonomous-vehicle fleet partnerships, advertising and membership, using a platform model to connect multiple technology and fleet providers. Relative to building a proprietary asset-heavy fleet, the partnership model reduces both technology-pathway and capital risk.
For 2026 H2, cash generation in the core businesses should remain resilient, but the 12.13% first-half share-price decline reflects renewed market repricing of valuation, regulation and autonomous-driving competition. The next leg of performance will depend on sustained free cash flow, repurchases and tangible incremental contribution from autonomous vehicles.
2. CarMax, Inc. (NYSE: KMX)
CarMax, Inc. is a large US used-vehicle retail and finance platform with a national store network, online transaction capabilities, procurement and pricing expertise, and an in-house finance operation. The model spans the vehicle lifecycle value chain. In 2026 H1, the share price rose from US$38.64 to US$52.89, an increase of US$14.25, or 36.88%.
In fiscal 2027 Q1, net revenue was approximately US$8.0 billion, up 6.2% year on year. Combined retail and wholesale unit sales increased 3.3% to 392,400 vehicles, while comparable retail unit sales declined 0.8%. Scale recovered, but consumer affordability continued to constrain retail elasticity.
The company is advancing omnichannel integration, inventory turnover and financing risk control, while completing a management transition. The strategic priority is to improve unit economics through lower customer-acquisition costs and faster turns rather than simply expand inventory.
For 2026 H2, interest rates, used-vehicle prices and credit losses will determine profitability. A more accommodative financing environment could support volume recovery and unlock meaningful fixed-cost leverage; otherwise, inventory write-downs and credit costs will continue to pressure returns.
[For more insights, please download the full report]

MACROECONOMY UPDATES
Old Narratives Linger, New Patterns Take Hold;
Global Economy Renegotiating the Line Between Slow Growth and Elevated Friction Costs
Global Economy Growth
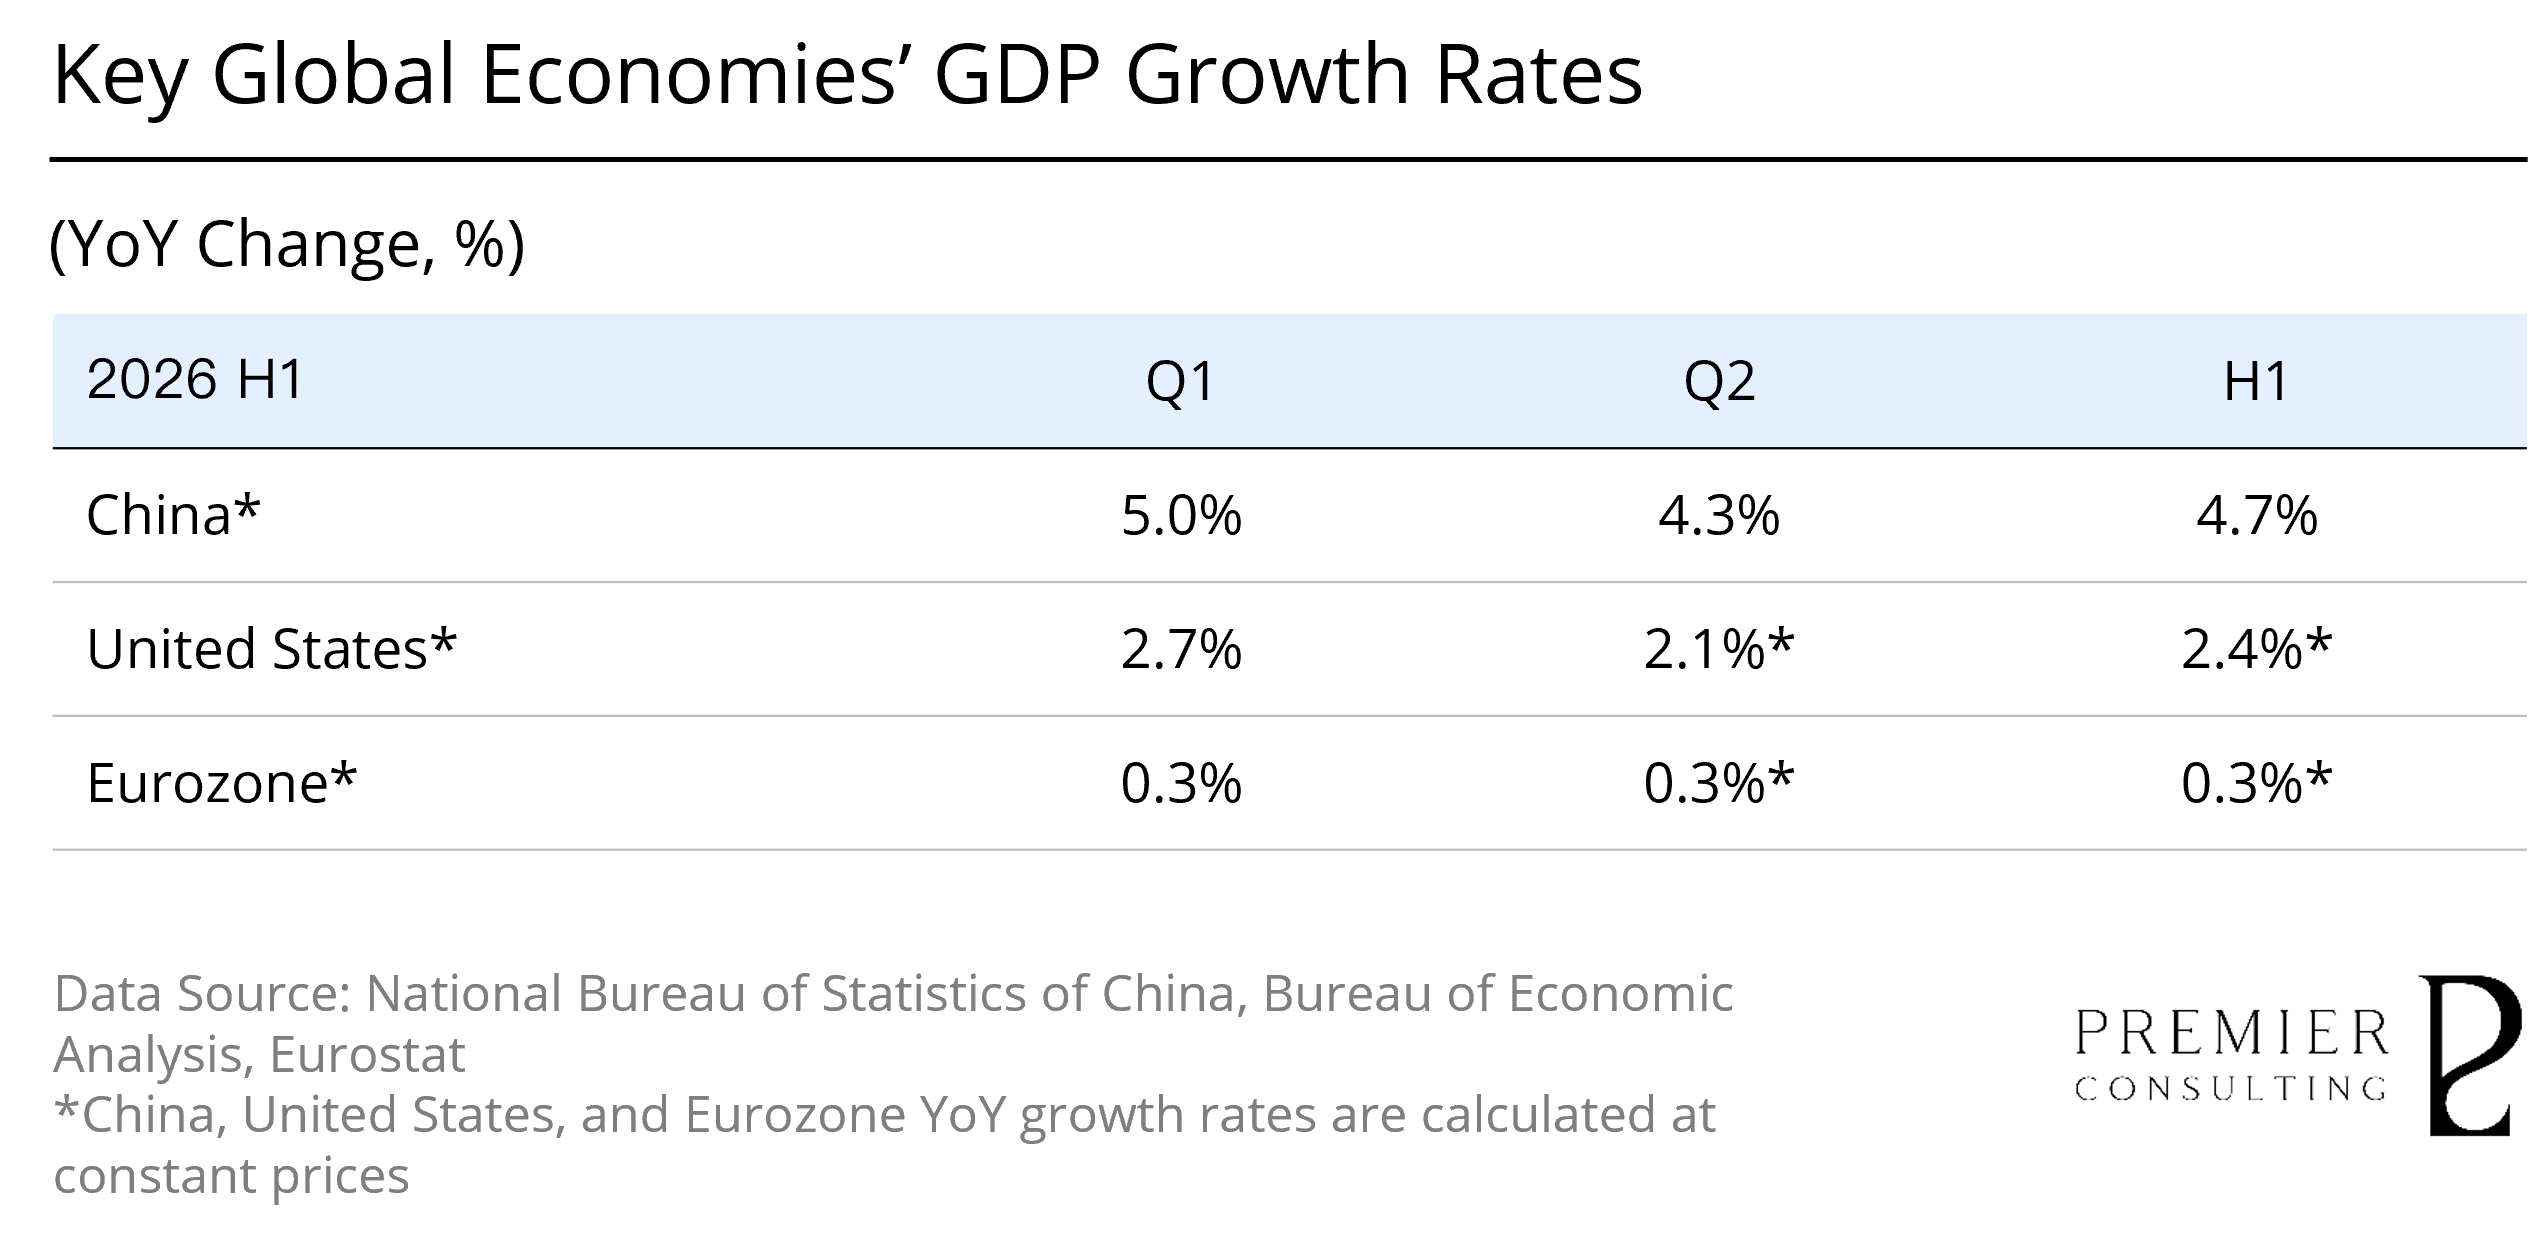
Global: Moderate Expansion amid Structural Divergence;
Technology Tailwinds Constrained by Policy Frictions
In the first half of 2026, the global economy continued to expand at a subdued pace, avoiding a synchronized recession but facing materially higher economic frictions. Divergent full-year growth projections from major international institutions reflect the persistent effects of energy prices, geopolitical conflicts, and trade policies on investment, purchasing power, and cross-border demand. Investment in artificial intelligence, semiconductors, data centers, and related infrastructure continued to generate pockets of incremental growth. Global momentum therefore remained intact, but became increasingly concentrated and more sensitive to shifts in policy and costs.
The growth gap between advanced economies and emerging market and developing economies widened further. US GDP is estimated to have grown by 2.4% in the first half, supported by capital expenditure in technology, energy, and advanced manufacturing; the Eurozone is estimated to have expanded by only 0.3%, constrained by energy costs, fiscal limitations, and industrial competitiveness. By contrast, emerging market and developing economies, led by China, maintained faster growth. China expanded by 4.7% in the first half, with manufacturing upgrading, export competitiveness, and high-tech industries contributing the principal incremental gains. Although tariffs and supply-chain risks disrupted global trade, market diversification continued to provide a buffer for selected economies.
The policy environment became increasingly data-dependent. Renewed pressure from energy and trade costs raised inflation risks, requiring major central banks to maintain a cautious balance across price stability, growth, and financial stability; a rapid shift toward broad-based global monetary easing therefore remained unlikely. Fiscal resources were increasingly directed toward defense, energy, digital infrastructure, and advanced manufacturing, while equity markets continued to support related capital expenditure. By contrast, the pricing of bonds, commodities, and safe-haven assets became more sensitive to conflict escalation, renewed inflation, and policy uncertainty.
[For more insights, please download the full report]
Manufacturing Purchasing Managers' Index Review
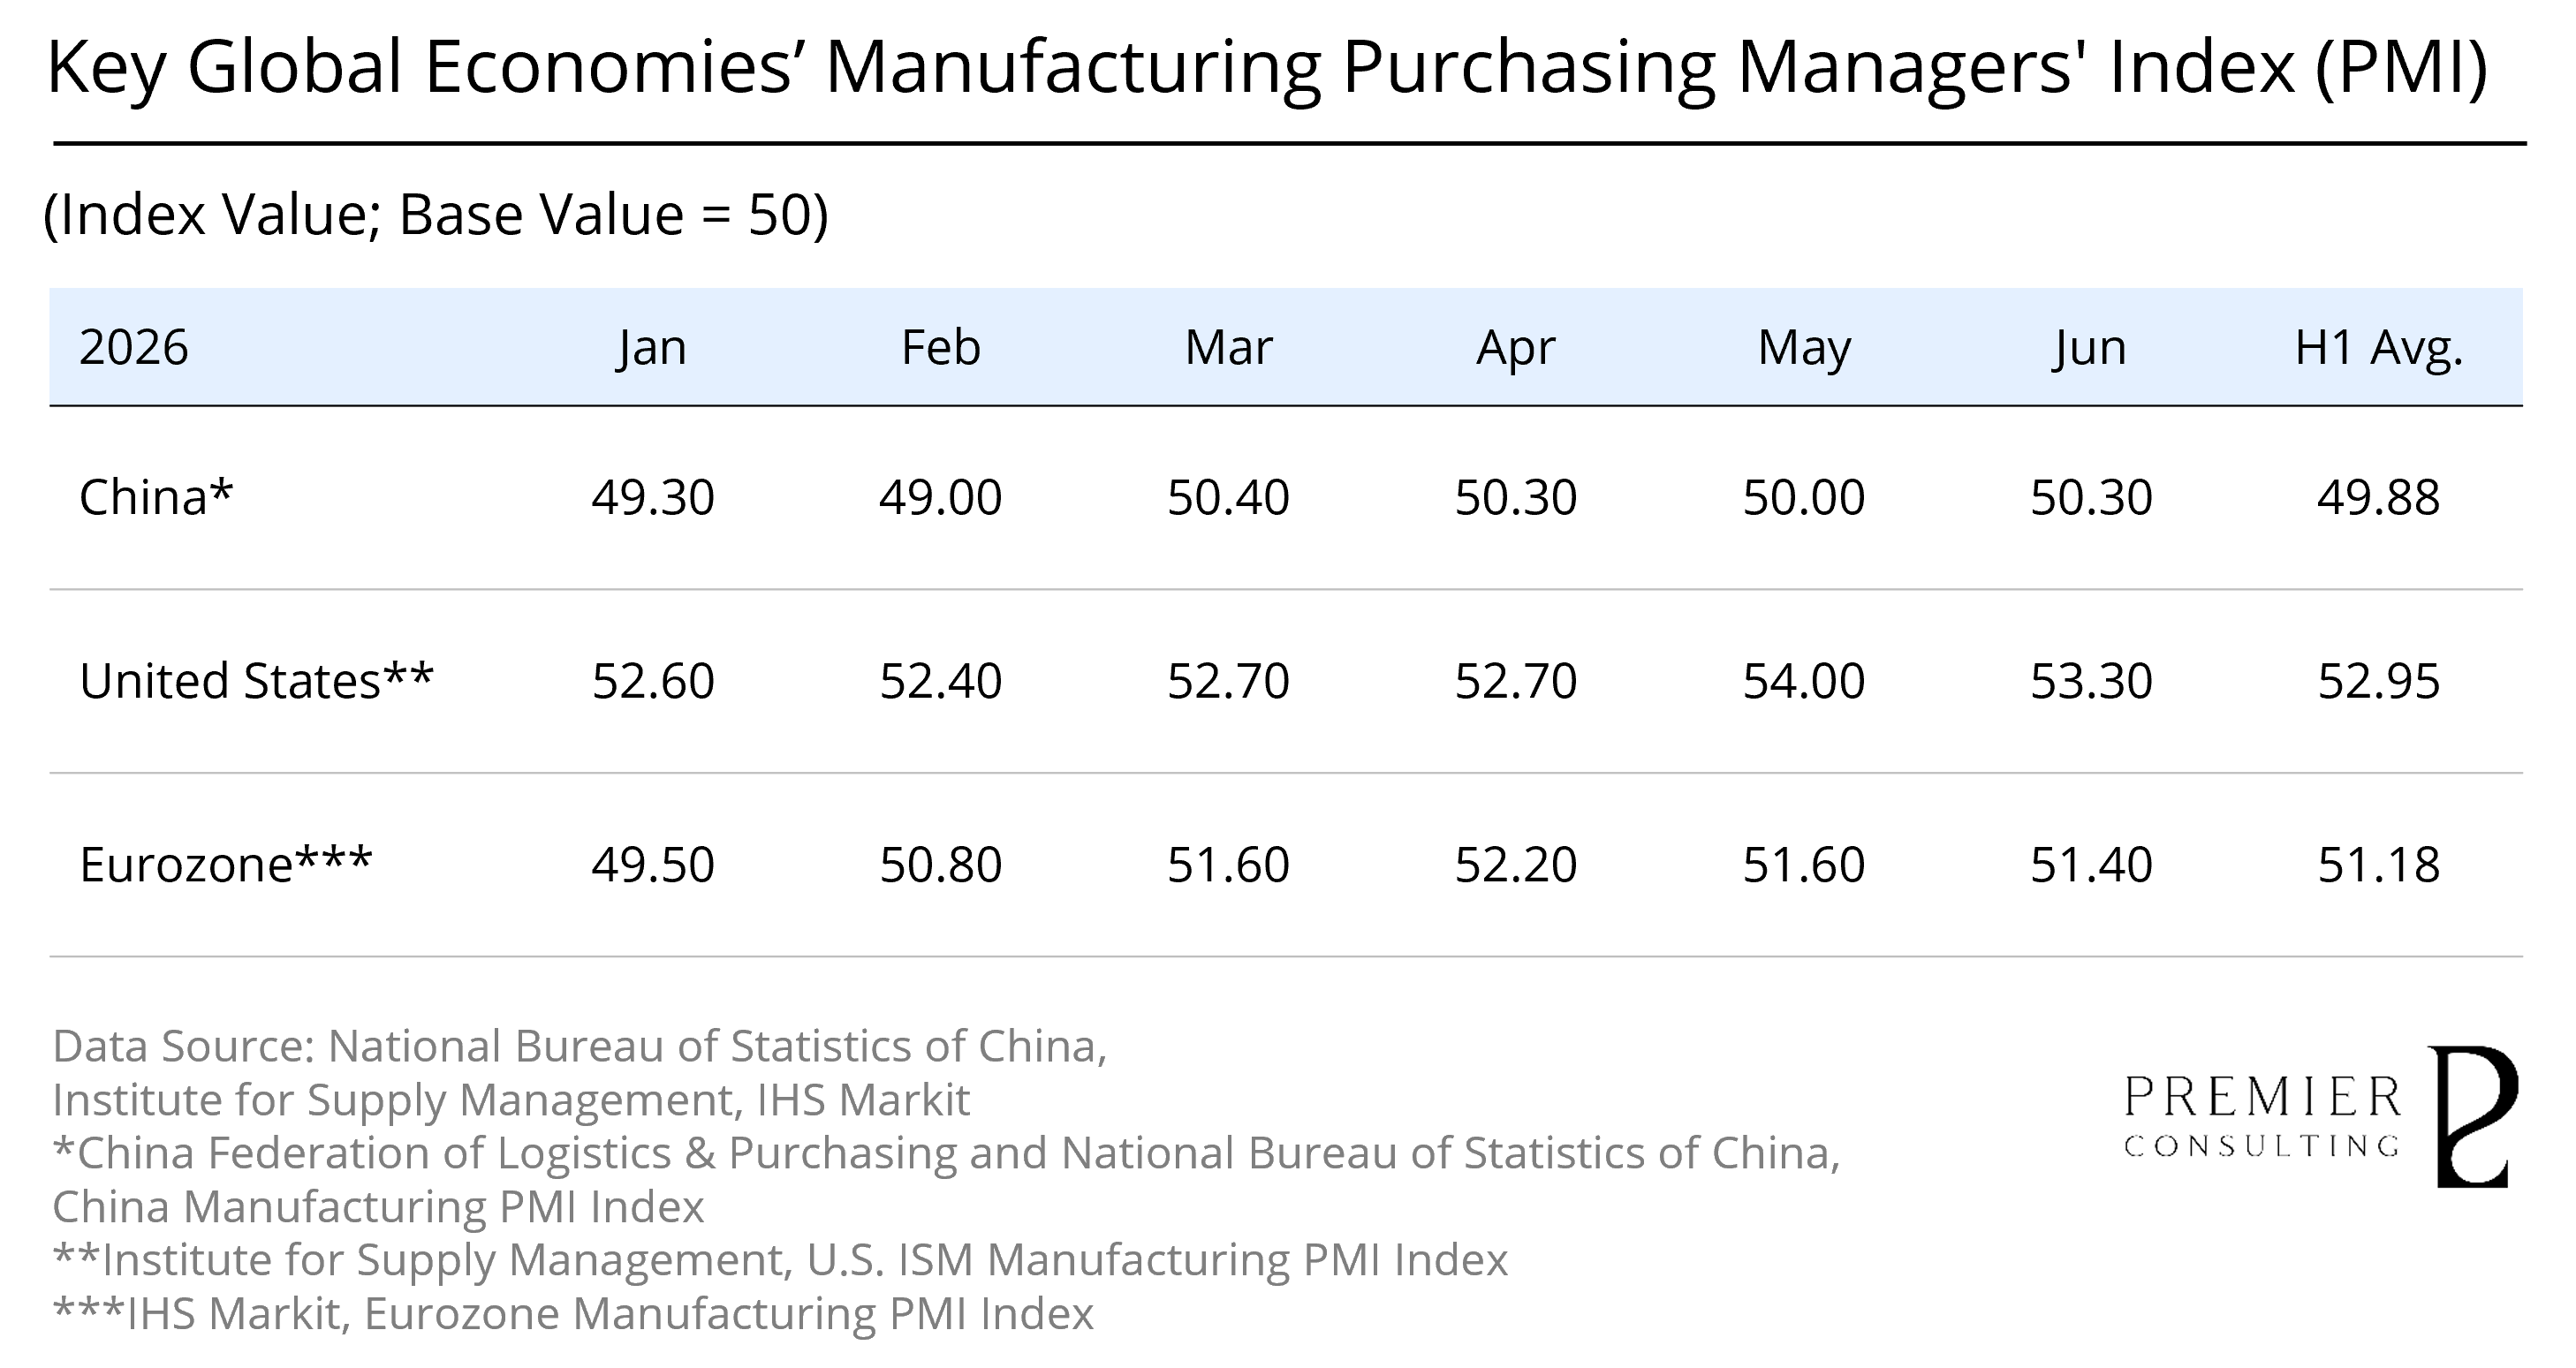
China: Production Expansion and Structural Upgrading Advance in Parallel;
Demand Recovery and Growth Broadening Remain Limited
China’s manufacturing sector continued to grow in the first half of 2026, although production expansion and corporate operating conditions did not improve in full alignment. Value added of industrial enterprises above designated size increased by 5.4% year on year, while manufacturing value added rose by 5.6%, confirming that industrial production remained an important source of support for the economy. At the same time, weak domestic demand and a more complex external trade environment left selected industries exposed to price competition, inventory pressure, and weaker profitability. Manufacturing growth remained relatively stable, but the foundations for expansion require further strengthening.
In terms of operating momentum, manufacturing gradually moved back above the expansion threshold after a weak start to the year. The manufacturing PMI rose from 49.3 in January and 49.0 in February to 50.4 in March and 50.3 in April, registered 50.0 in May, and increased further to 50.3 in June. The first-half average of 49.88 indicates that activity fluctuated narrowly around the 50-point threshold. Improvements in production and orders lifted overall business conditions, but small and medium-sized enterprises, employment, and inventory intentions remained comparatively weak, indicating that demand recovery had not yet transmitted across the full manufacturing value chain.
Technological and structural upgrading continued to provide critical support for manufacturing growth. High-tech manufacturing value added increased by 13.3% in the first half, materially outpacing both industrial enterprises above designated size and manufacturing overall, while investment in equipment manufacturing and high-tech industries remained comparatively active. Advanced manufacturing, new-energy platforms, intelligent vehicle configurations, and core-component capabilities continued to increase the technological intensity of the production system. Manufacturing momentum therefore became more concentrated in technology-intensive, capital-intensive, and higher-value-added segments, partly offsetting the effects of weak traditional demand.
[For more insights, please download the full report]
Retail Sales Growth Review & Outlook
China: Services Consumption and Digital Channels Lead Growth;
Automotive Demand and Price Expectations Remain under Pressure
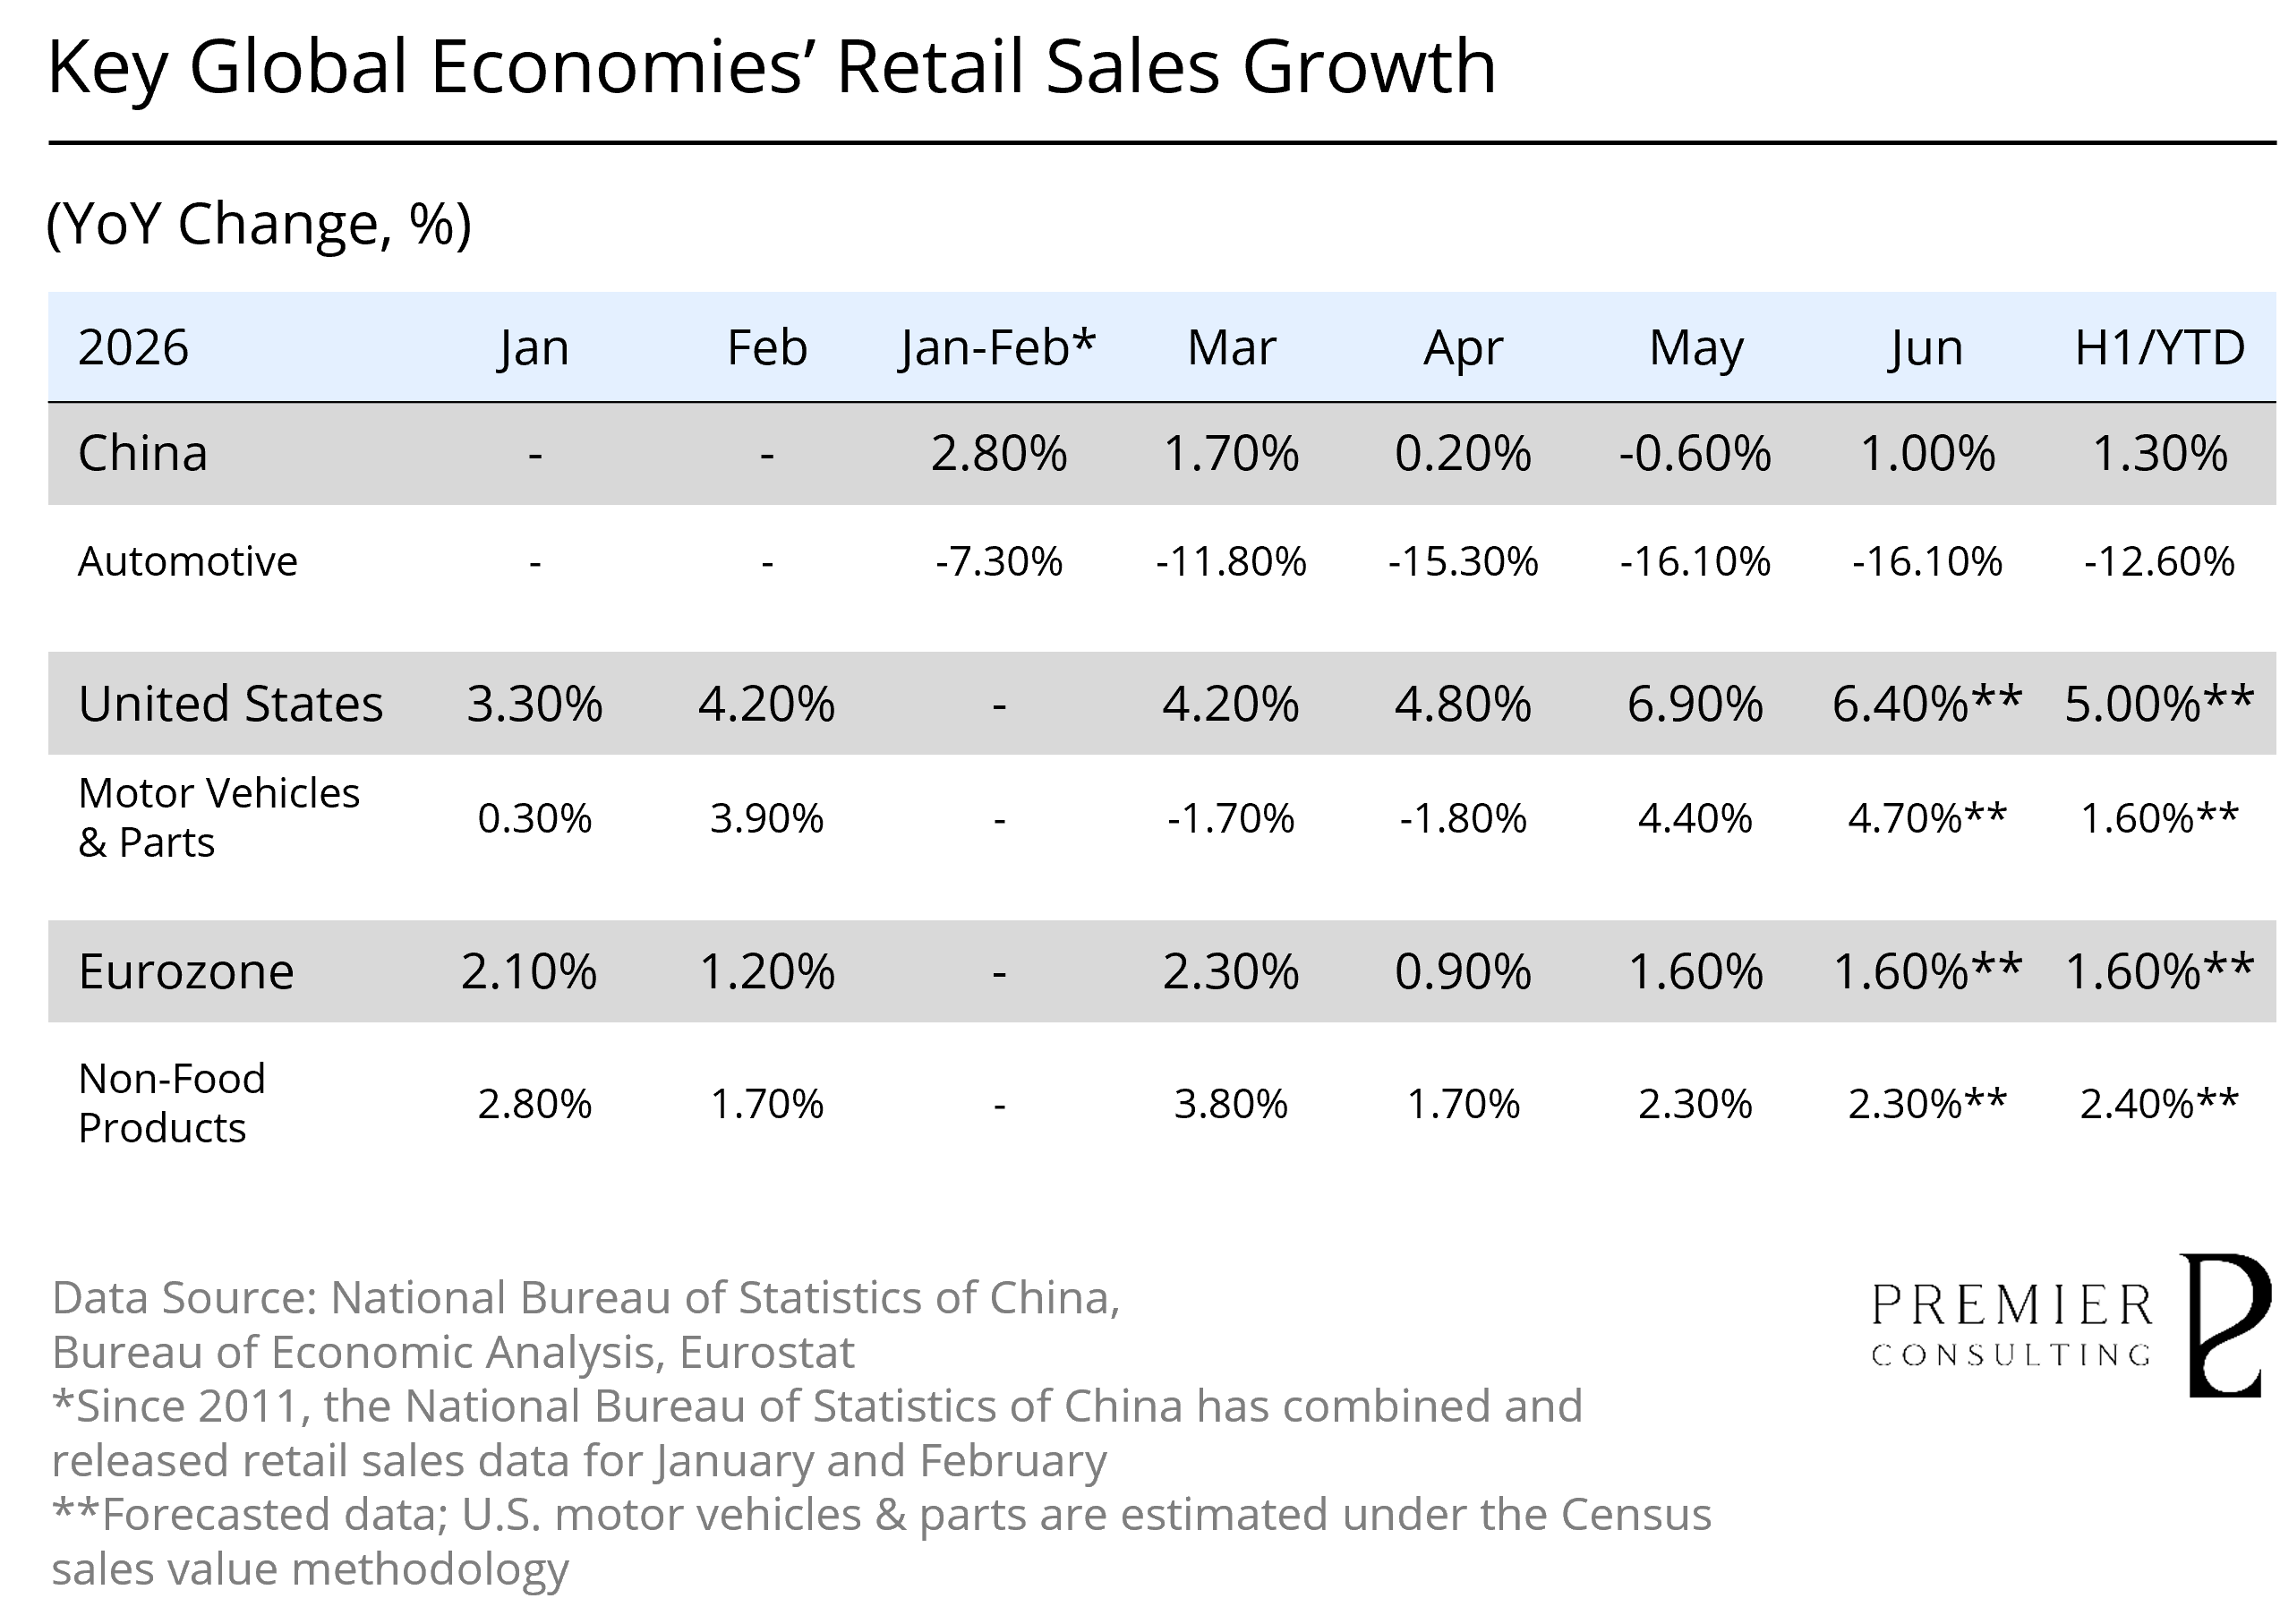
China’s total retail sales of consumer goods increased by 1.3% year on year in 2026 H1. The consumer market continued to expand, but at a relatively slow pace. Monthly growth decelerated from 2.8% in January-February to 1.7% in March and 0.2% in April, before falling by 0.6% in May and recovering to 1.0% in June, indicating that the foundations of goods consumption remained unstable. By contrast, service retail sales increased by 5.3% and online retail sales of goods and services rose by 5.2%, materially outpacing total retail sales of consumer goods. Incremental consumption therefore came increasingly from services, digital channels, and consumption occasions offering immediate and tangible value.
Policy support continued to provide a degree of stabilization for vehicle replacement and new energy vehicle purchases, while demand shifted further toward new energy models. New energy vehicle sales reached 7.446 million units in the first half of 2026, up 7.3% year on year, and their share of total new vehicle sales rose to 58.5% in June. Existing subsidies and replacement support, together with an increasingly diverse supply of new energy products, accelerated the shift in market structure. New energy vehicles therefore continued to grow despite weakness in the broader automotive market and remained an important source of support within durable-goods consumption.
However, policy support did not generate a broad recovery in automotive consumption. Automotive retail sales fell by 12.6% year on year in the first half, declining by 7.3% in January-February, 11.8% in March, 15.3% in April, and 16.1% in both May and June, indicating that pressure intensified through the second quarter. Price competition, the timing of policy implementation, and consumer expectations of further price reductions collectively delayed purchase decisions. At the powertrain level, battery electric vehicle sales increased by 13.0%, while PHEV and range-extended electric vehicle sales declined by 2.5%, highlighting widening divergence within the new energy vehicle market. Policy support can underpin selected demand, but frequent price reductions and wait-and-see behavior weaken the continuity of demand release.
[For more insights, please download the full report]

INDUSTRY KEY FIGURES
Scale Reaches Its Limits, Quality of Operations Takes Over;
China Auto Shifting from Volume Competition to Value Realization and Global Reach
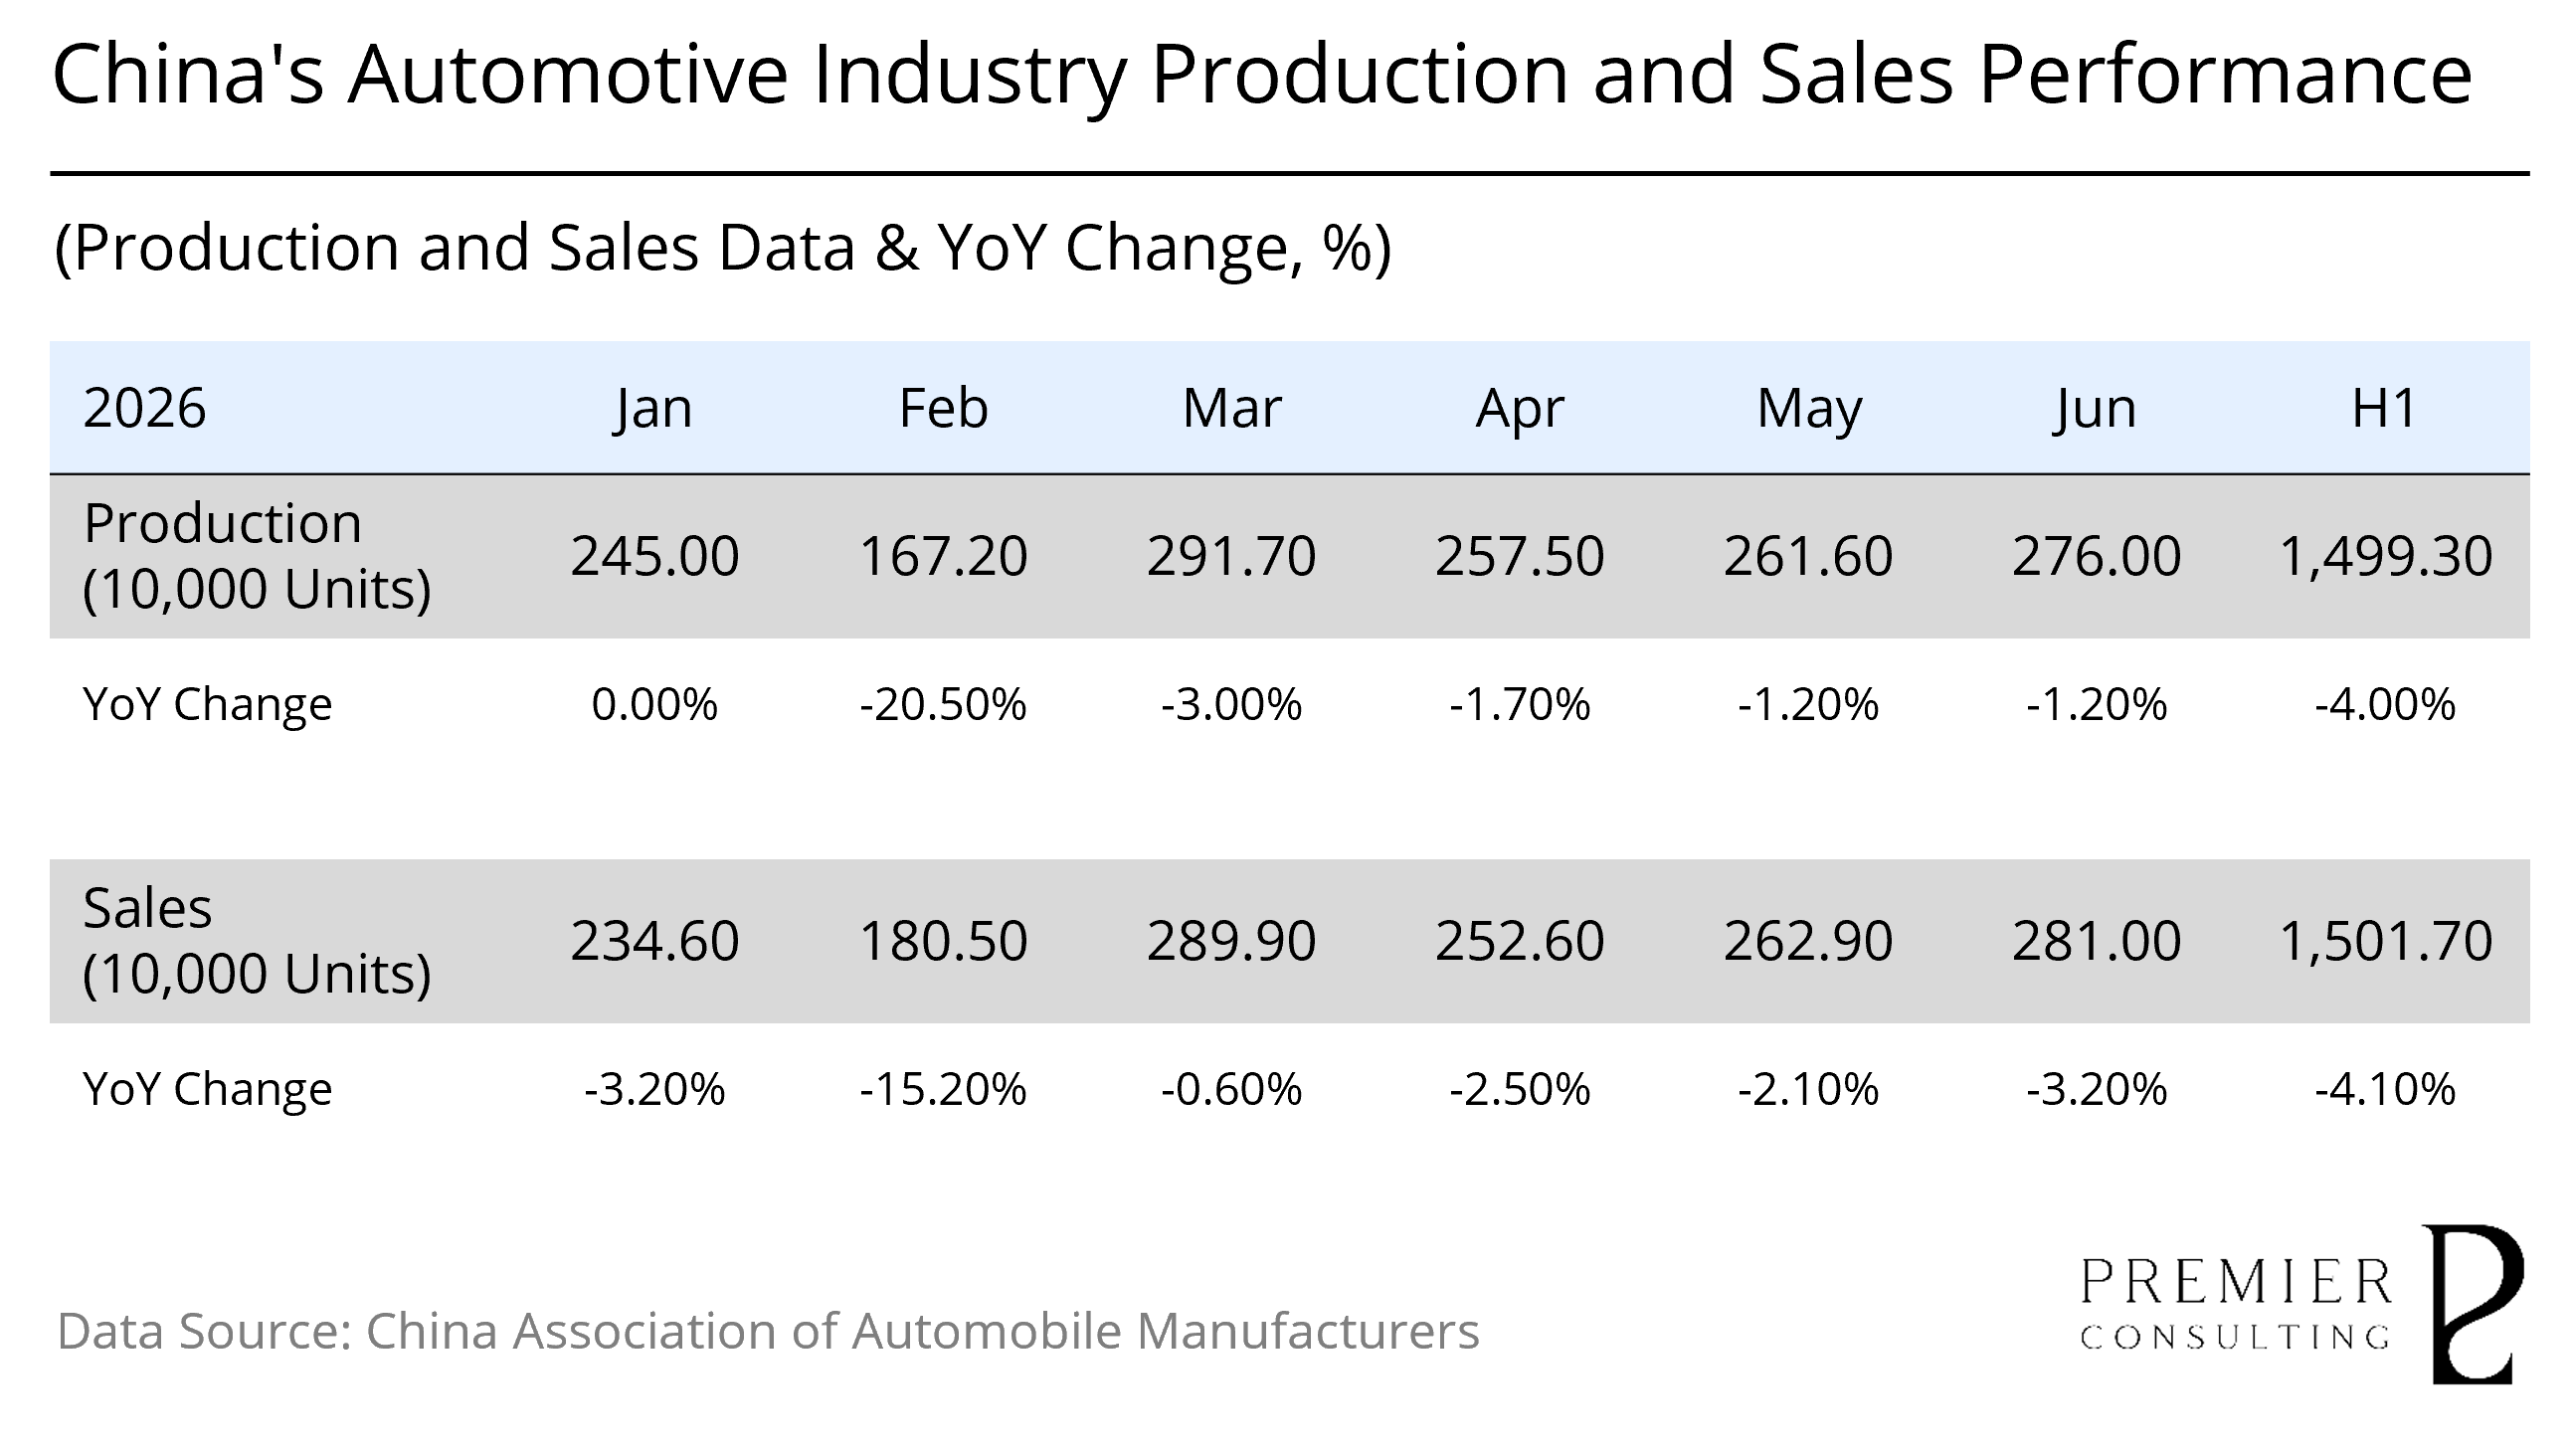
Production and Sales Remain under Pressure, but Declines Narrow Month by Month; June Rebounds Sequentially as Exports and NEVs Stabilize the Industry Base
In 2026 H1, China’s automotive industry shifted from rapid expansion to a period of volume adjustment. From January to June, vehicle production and sales reached 14.993 million and 15.017 million units, respectively, down 4.0% and 4.1% year on year. Although industry volumes remained below cAt the beginning of the year, the market first absorbed the effects of policy transition, the front-loading of earlier demand, and a high comparison base. Vehicle production and sales fell by 6.9% and 5.6% in the first quarter. At the same time, continued price competition and rapid product refresh cycles lengthened the purchase-decision process for some consumers, while contraction in internal-combustion-engine vehicle demand intensified pressure on the domestic market. Continued NEV growth and rapid export expansion provided a structural offset to the decline in aggregate volumes.
In the second quarter, the recovery was reflected primarily in narrowing declines rather than a broad-based reversal in end demand. June production and sales reached 2.760 million and 2.810 million units, rising 5.5% and 6.9% month on month, but remaining 1.2% and 3.2% lower year on year. Domestic sales fell by 21.1% in the first half, while automotive exports increased by 65.3%, indicating that the current stabilization is being driven more by external demand, NEVs, and commercial vehicles, with domestic consumption momentum yet to recover.
Looking ahead to 2026 H2, the orderly implementation of the “Two Renewals” policy package, a richer pipeline of new product launches, and a more stable pricing environment should support a gradual improvement in vehicle demand. Overall, sustained export growth and rising NEV penetration should protect industry scale, but channel inventory, domestic consumption, and pricing discipline will determine the quality of the recovery. Competition will increasingly shift from the pursuit of volume alone toward the delivery of stronger product mix, operating efficiency, and globalization capabilities
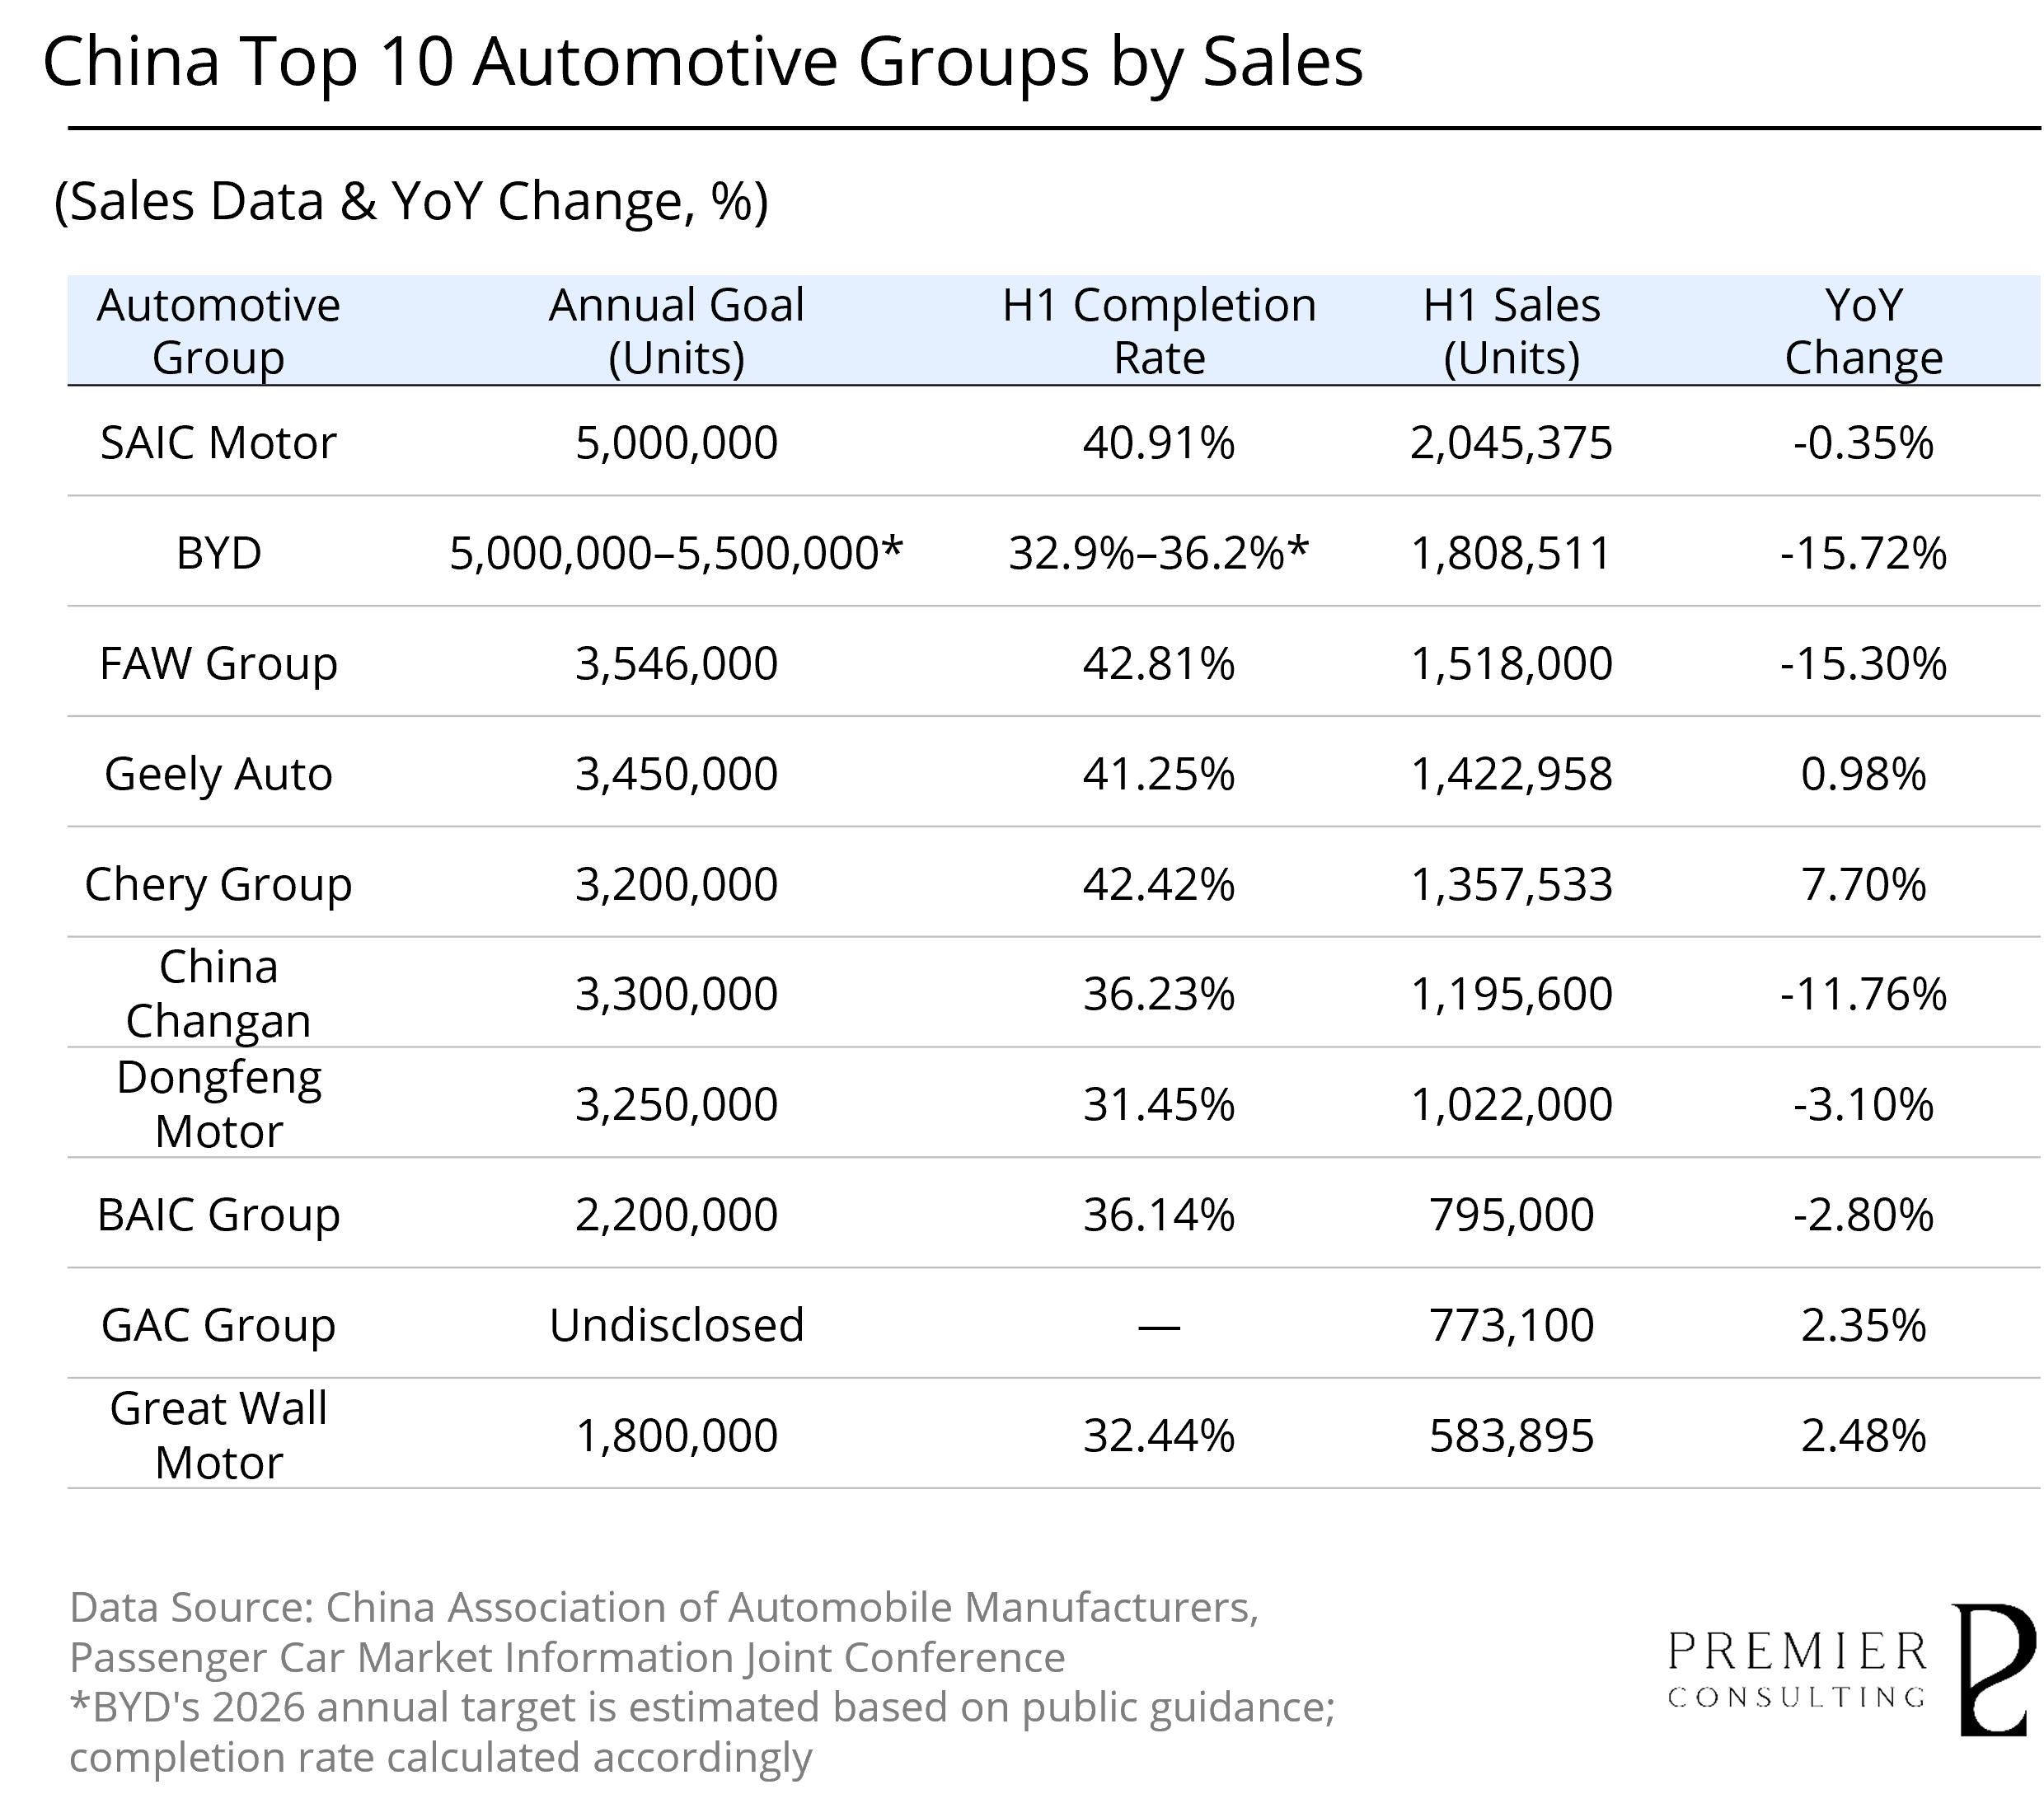
SAIC Retains the Scale Lead and Chery Tops Growth; BYD, FAW, and Changan Post Double-Digit Declines as H2 Becomes the Critical Delivery Window
In 2026 H1, SAIC Motor Group and BYD retained the top two positions among China’s major automotive groups, with cumulative sales of 2.0454 million and 1.8085 million units, respectively. FAW Group, Geely Auto, and Chery Group formed the second tier, with sales of 1.5180 million, 1.4230 million, and 1.3575 million units. Of the ten groups, only Geely, Chery, GAC, and Great Wall Motor delivered year-on-year growth; the other six recorded varying degrees of decline. Scale continued to determine the leading positions, but growth momentum diverged materially.
SAIC sold 2.0454 million vehicles in the first half, maintaining the leading position by a margin of more than 230,000 units. Sales declined only 0.35% year on year, broadly preserving the prior-year scale. The group completed 40.91% of its five-million-unit annual target, placing it relatively ahead of peers on delivery progress. Its current lead, however, reflects the continuation of its established scale and multi-brand portfolio more than incremental growth. To meet the full-year target, average monthly deliveries in the second half will need to accelerate materially from the first-half run rate.
BYD sold 1.8085 million vehicles in the first half, retaining second place, but sales declined by 15.72% year on year—the steepest fall among the ten groups. Based on an estimated full-year target of five to 5.5 million units, first-half completion was approximately 32.9% to 36.2%, materially behind the elapsed-time benchmark at either end of the range. BYD’s scale advantage remains intact, but the first-half contraction has raised the delivery threshold for the second half; meeting the full-year target will require a stronger new-model cycle and a meaningful recovery in sales momentum.
FAW Group ranked third with first-half sales of 1.5180 million vehicles, down 15.30% year on year—only slightly better than BYD. In contrast to the sales decline, FAW completed 42.81% of its 3.546-million-unit annual target, the highest progress among companies with disclosed targets. The coexistence of a double-digit sales decline and leading target completion suggests that its annual target is relatively well calibrated to its existing scale. Nevertheless, the group must reverse the downward trend quickly in the second half to prevent its current completion-rate advantage from being progressively eroded.
Geely Auto and Chery Group operated at similar scale, but both delivered materially stronger growth quality than most leading groups. Geely sold 1.4230 million vehicles, up 0.98% year on year, and completed 41.25% of its 3.45-million-unit annual target, preserving positive growth despite broad industry pressure. Chery sold 1.3575 million vehicles, up 7.70%—the fastest growth among the ten groups—and completed 42.42% of its annual target. Across scale, growth, and target progress, Chery demonstrated the most balanced operating profile.
Changan Automobile sold 1.1956 million vehicles in the first half, ranking sixth, with sales down 11.76% year on year and 36.23% of its 3.3-million-unit annual target completed. Its sales base has already opened a meaningful gap with the top five, while the double-digit decline further increases the delivery burden for the second half. Closing the gap to the annual target will require not only a return to sales growth but also a higher average monthly delivery run rate; maintaining the current pace will no longer be sufficient.
Dongfeng Motor Group and BAIC Group faced pressure on both sales performance and target progress. Dongfeng sold 1.0220 million vehicles, down 3.10% year on year, and completed only 31.45% of its 3.25-million-unit annual target—the lowest progress among companies with disclosed targets. Without a visible improvement in the second half, the probability of meeting the full-year target will decline further. BAIC sold 795,000 vehicles, down 2.80%, and completed 36.14% of its 2.2-million-unit target. Although its progress exceeded Dongfeng’s, it remained materially behind the elapsed-time benchmark.
GAC Group and Great Wall Motor maintained growth from relatively lower sales bases. GAC sold 773,100 vehicles, up 2.35% year on year and ranking ninth among the ten groups. As it has not disclosed a full-year sales target, the pace of annual delivery cannot yet be assessed. Great Wall Motor sold 583,900 vehicles, up 2.48%, slightly outpacing GAC’s growth, but completed only 32.44% of its 1.8-million-unit annual target. A return to growth has not yet translated fully into target delivery, and a higher delivery baseline will be required in the second half.
Across the nine groups with disclosed targets, none reached a 50% completion rate in the first half; most were concentrated between 31% and 43%. FAW, Chery, Geely, and SAIC exceeded 40% and were relatively ahead; Changan, BAIC, and BYD were in the mid-range of approximately 33% to 36%; Great Wall and Dongfeng were close to or below 32%. Most groups have therefore deferred a larger share of their annual delivery requirement to the second half. Target completion and year-on-year growth must be assessed together, as neither metric alone is sufficient to capture the underlying operating position.
Overall, the competitive landscape in the 2026 H1 was characterized by a misalignment across scale, growth, and target progress. SAIC and BYD continued to lead in sales, but neither returned to positive growth; FAW ranked highly on target progress despite a double-digit sales decline; Chery combined faster growth with stronger target completion, while Geely, GAC, and Great Wall also maintained positive growth. Changan, Dongfeng, and BAIC faced varying degrees of pressure on sales and delivery. In the second half, the ability to convert new-product launches, domestic-demand recovery, export expansion, and the evolving NEV mix into effective deliveries will further widen the operating gap between groups.

PRIMARY INDEX REVIEW & PROSPECT
Penetration Continues, Returns Diverge;
Valuations Retreat as Sector Pricing Shifts from Growth to Earnings
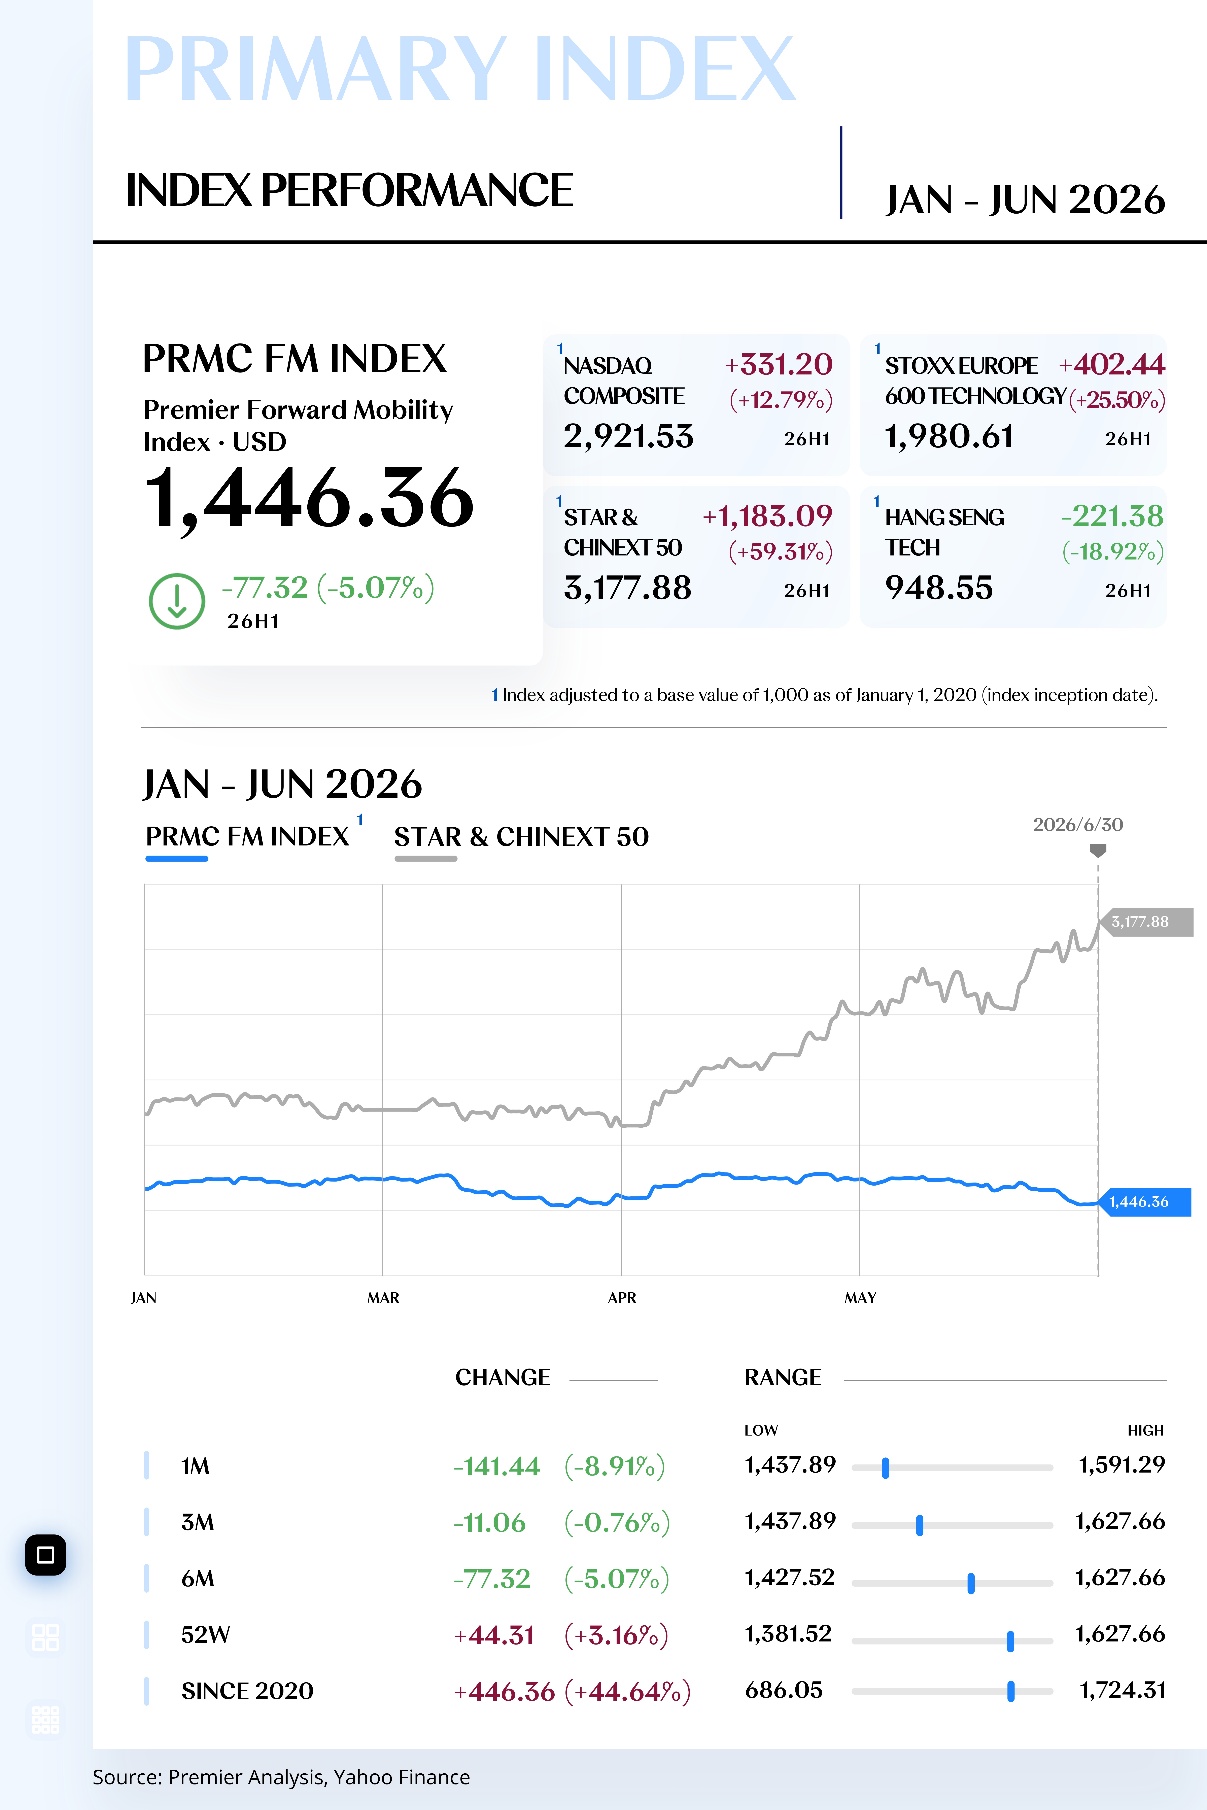
As of June 30, 2026, the PRMC Forward Mobility Index closed at 1,446.36 points, down 5.07% from the beginning of the year.
From January to February, the index advanced in a volatile but upward trajectory, gaining 5.98% cumulatively. It rose by 2.31% in January and a further 3.59% in February. Higher battery-electric-vehicle penetration in Europe, continued growth in China’s NEV sales and exports, stronger energy-storage demand, a temporary recovery in lithium prices, and expectations around intelligent driving collectively improved market sentiment. The Supply Index benefited from resource restocking and energy-storage demand, while the Manufacturing Index also posted moderate gains. At this stage, the market continued to price the long-term growth opportunity associated with volume expansion, rising electrification penetration, and intelligent-vehicle technology upgrades.
In March, external shocks interrupted the earlier rally and pushed the index into a sharp correction, with a monthly decline of 9.74%. The Supply, Manufacturing, and Service secondary indices all weakened. Conflict in the Middle East and disruption around the Strait of Hormuz lifted energy prices, transmitting risk from oil into inflation expectations, policy rates, and asset discount rates. Higher transportation, raw-material, and financing costs also compressed household discretionary spending and corporate margins. While higher oil prices improve the relative economics of electrification over the medium to long term, their immediate effect is to raise operating and capital costs, creating a net negative impact on high-duration future-mobility growth assets.
In April, improving risk appetite drove a tactical recovery, with the index rebounding 9.91%. The scale of the recovery, however, diverged sharply by segment. The Supply and Service indices rose by 15.13% and 15.79%, respectively, while the Manufacturing Index gained only 2.02%. Although market risk appetite recovered, capital increasingly favored assets with resource-price elasticity, supply constraints, or demonstrable service revenues. For vehicle and hardware manufacturers, higher penetration and delivery growth were no longer sufficient to support valuations on their own; margins, inventory, capital expenditure, and revenue quality began to carry greater weight.
From May to June, April’s recovery lost momentum and the index returned to a volatile downward channel, declining by approximately 9.7% over the two months. The Manufacturing Index fell by about 14.4%, becoming the largest drag in the later period. China’s first-half vehicle sales declined by 4.1% year on year and passenger-vehicle sales fell by 6.0%, while NEV sales increased by 7.3% and automotive exports rose by 65.3%. This created a market structure characterized by weak domestic demand, rapid export expansion, and continued powertrain upgrading. Sales and exports continued to support scale, but price competition, channel subsidies, and model-refresh pressure prevented revenue growth from translating consistently into profit. European EV demand remained positive, but countervailing tariffs and local-production requirements increased overseas operating costs, while North America sought a new demand equilibrium following reduced policy support. Export scale therefore could not be equated directly with overseas profit, and higher NEV penetration did not offset pressure on manufacturing margins, inventory, and return on capital. Over the same period, the Supply Index retreated after reaching a local peak in May, while the Service Index corrected after setting a new high in early June. The first half therefore ended with a deep manufacturing decline and gains at both ends of the value chain that were insufficient to offset it.
Looking ahead to the second half of 2026, the direction of the index will be determined primarily by four sets of variables: energy prices and real interest rates; the earnings quality of China’s automotive sector; market rebalancing in Europe and the United States; and the commercialization of mobility services. If lower energy prices ease inflation and real rates, pricing discipline and channel inventory improve in China, and incremental European electrification demand can absorb tariff and localization costs, manufacturing may offer greater recovery elasticity. If the high-cost and high-rate environment persists, resource advantages in the upstream and commercialization visibility in services may retain their relative lead. Valuations for autonomous driving and mobility services will need to move beyond licenses and test mileage toward vehicle utilization, paid mileage, safety costs, cash burn, and the efficiency of replication across cities. Under the base case, the primary index is more likely to follow a path of sector rotation and asynchronous company inflection points than a synchronized value-chain rally.
[For more insights, please download the full report]

SECONDARY INDEX REVIEW & PROSPECT
Value Migrates Along the Chain;
Resources Regain Elasticity, Services Command a Premium, Manufacturing Absorbs Scale Discounting
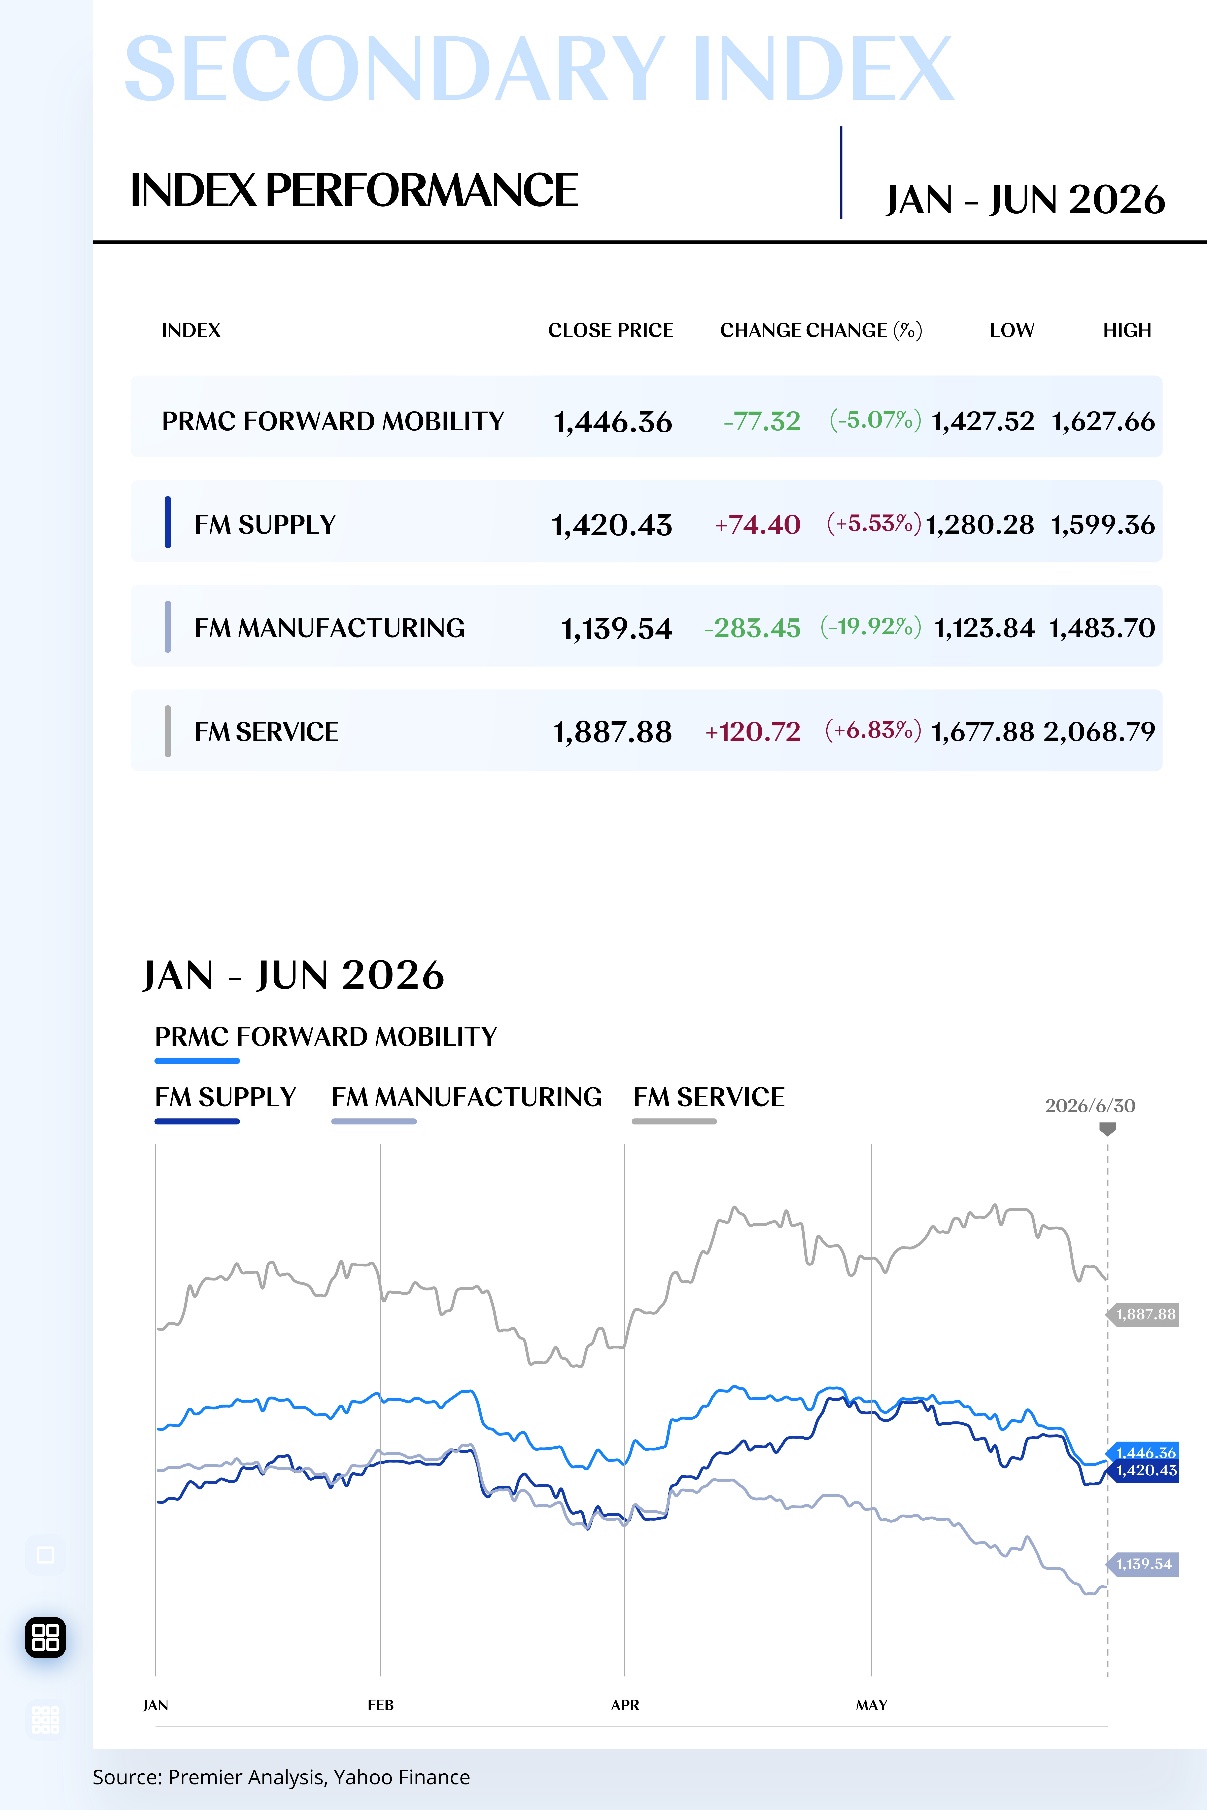
As of June 30, 2026, the PRMC Forward Mobility Supply Index closed at 1,420.43 points, up 74.40 points, or 5.53%, from the end of 2025.
The global economy remained in low-speed expansion during the first half of 2026, but uncertainty increased around energy prices, trade policy, and the interest-rate path. Conflict in the Middle East lifted oil prices, transportation costs, and inflation expectations, constraining further monetary easing by major central banks and compressing valuations for high-duration growth assets. At the same time, European electrification regulation, China’s industrial upgrading, and resilient exports continued to support market expectations for critical minerals, clean energy, and intelligent components.
Compared with the Manufacturing Index, the Supply Index is more sensitive to resource prices, inventory, and supply-demand cycles. Its first-half gain, however, was not driven solely by a rebound in commodities. Energy storage, grid investment, battery demand, and rising penetration of automotive electronics and intelligent systems improved in parallel, strengthening earnings expectations for companies with resource advantages, technological barriers, and diversified end-market exposure. This enabled the index to materially outperform manufacturing.
Raw materials—including lithium, nickel, cobalt, and copper—continued to support the index, although the drivers varied significantly by metal. Lithium benefited from energy-storage demand, low inventories, and selected supply disruptions; copper was supported by investment in grids and data centers; cobalt gains were driven more by export restrictions; and nickel remained constrained by new capacity. Higher prices support low-cost miners and materials suppliers, but capacity expansion, restarts, and inventory release may still cap earnings elasticity.
Traditional automotive components showed a more differentiated recovery. Chassis, braking, thermal-management, and body systems benefited from growth in hybrid, battery-electric, and export models, but declining demand for internal-combustion-engine vehicles, automaker cost-reduction requirements, and raw-material costs continued to compress margins. Companies with multi-powertrain platform compatibility, diversified global customer exposure, and stronger cost pass-through capability were relatively better positioned; the segment has not yet entered a broad cyclical rebound.
Compared with traditional components, electronic control systems, power semiconductors, sensors, and connected-vehicle hardware retained higher growth expectations. Rising electronic content per vehicle and increasing penetration of centralized computing favor suppliers with capabilities across chips, software, system integration, and automotive-grade validation. However, long automotive certification and production cycles mean that technology advantages must still be converted into nominations, revenue, and profit.
Power batteries and electric-drive systems continued to benefit from higher vehicle installations and energy-storage demand in the first half. China’s installed power-battery volume increased year on year, the share of lithium iron phosphate expanded further, and energy-storage batteries became an important source of incremental demand. Nevertheless, cell-price competition, capacity utilization, and capital expenditure continued to constrain profitability. Whether shipment growth can translate into gross margin, cash flow, and return on capital remains central to valuation recovery.
Suppliers of AI-enabled driving systems, in-vehicle operating systems, and intelligent-connected platforms also retained strong market attention. Improving regulation, more centralized electronic architectures, and a growing number of mass-production nominations enhanced the long-term value of computing platforms, sensors, and software suppliers. At the same time, hardware price reductions, automaker in-house development, and functional integration intensified competition. Market pricing is shifting from technology concepts toward installed scale, software revenue, and commercialization capability.
Looking ahead to the second half of 2026, the Supply Index will continue to be shaped by resource prices, supply restoration, end demand, and capital costs. If energy-storage and grid demand remain robust and mine restarts fall short of expectations, critical-material prices and the earnings of low-cost producers should remain supported. If supply is released rapidly while EV demand slows, resource prices and capacity utilization may come under renewed pressure. The ability to improve margins and free cash flow will determine the next stage of valuation upside.
In a “growth repricing” environment, investors should place greater emphasis on the alignment between technological barriers and earnings conversion. Advanced battery materials, power semiconductors, intelligent-driving sensors, centralized computing platforms, and highly integrated electronic-control and electric-drive systems retain growth potential. Sustained valuation premiums, however, will require automotive-grade certification, customer onboarding, production ramp-up, margin improvement, and cash collection to progress in parallel.
For traditional resource suppliers, priorities should include global resource positions, low cost curves, long-term orders, and capital discipline. High-cost, single-commodity, and highly leveraged companies remain exposed to considerable cyclical risk. Traditional component manufacturers can serve a defensive role through aftermarket exposure, multi-powertrain platform coverage, and stable cash flow, but growth potential will remain limited where electrification compatibility and system-integration capabilities are weak.
Investors should also monitor environmental and carbon requirements; NEV tax and subsidy policies; trade tariffs and localization requirements; battery safety and recycling standards; and regulation of intelligent driving and data security. These requirements will raise compliance, R&D, and capital-expenditure burdens for supply-side companies, but will also strengthen the market-access advantages of players with superior traceability, regional production, and technology-certification capabilities.
As of June 30, 2026, the PRMC Forward Mobility Manufacturing Index closed at 1,139.54 points, down 283.45 points, or 19.92%, from the end of 2025.
Global growth slowed in the first half of 2026, while energy prices, inflation, and financing costs rose, placing pressure on high-ticket discretionary purchases such as automobiles. As the core link between the supply chain and end demand, midstream manufacturing was affected simultaneously by vehicle affordability, raw-material volatility, supply-chain localization, and capital-expenditure pressure. Vehicle-manufacturer valuations therefore shifted further toward margins, cash flow, and capital efficiency.
With price competition persisting, divergence in vehicle manufacturers’ sales and profitability widened. Large-scale leaders could absorb part of the pressure through scale, cost control, product mix, and global footprints, but promotions, tariffs, investment in new platforms, and capacity utilization continued to constrain overall returns. The Manufacturing Index therefore underperformed both the Supply and Service indices by a wide margin, reflecting simultaneous earnings pressure and valuation compression.
In traditional internal-combustion-engine vehicles, gasoline and diesel models continued to lose share in markets such as Europe. Hybrid vehicles, premium models, and commercial vehicles nevertheless provided established automakers with order and cash-flow support. Companies with brand, channel, and scale advantages could preserve profitability through cost control, but emissions compliance, product renewal, and NEV substitution continued to limit long-term growth.
NEV manufacturing remained a key growth pillar, but high growth did not translate universally into high profitability. NEV sales and penetration continued to rise in China and Europe, with new models and exports supporting order growth. At the same time, price competition, overseas tariffs, localized production, and capital expenditure compressed per-vehicle profit, making performance increasingly dependent on capacity utilization, product mix, and cash flow.
Looking ahead to the second half of 2026, recovery in the Manufacturing Index will depend on platform-based cost reduction, an improving product cycle, and tangible earnings delivery. Modular architectures, multi-energy platforms, and intelligent manufacturing can lower unit costs, while new models and intelligent upgrades can improve product mix. However, if inventory, price competition, and overseas investment pressure persist, volume growth will remain insufficient to drive a broad valuation recovery.
The market should prioritize manufacturers with platform-based production, supply-chain integration, cost control, and global capacity-allocation capabilities, including automakers with core technology and scale advantages across battery-electric, hybrid, and intelligent-vehicle segments. A visible new-model cycle, overseas localization capability, stable margins, and capital-expenditure discipline will determine whether scale can be converted into earnings quality.
Traditional vehicle manufacturers can still provide a degree of defensiveness through brand equity, channel reach, after-sales networks, and mature cash generation, while hybrid products, exports, and premium models may extend their earnings cycles. However, NEV substitution, emissions regulation, tariffs, foreign-exchange movements, supply-chain volatility, and underutilized capacity remain key risks. The allocation case should therefore focus on transition efficiency and cash returns rather than legacy scale alone.
As of June 30, 2026, the PRMC Forward Mobility Service Index closed at 1,887.88 points, up 120.72 points, or 6.83%, from the end of 2025.
The increase does not indicate synchronous improvement across all downstream businesses. Rather, it reflects a market reassessment of recurring revenue, platform efficiency, and cash-flow quality amid pressure on manufacturing. Service assets with established earnings bases received a relative premium, while high-valuation frontier businesses with long commercialization timelines remained constrained by discount rates.
On one hand, financing costs and consumer monthly-payment pressure continued to limit automotive consumption, platform subsidies, and infrastructure investment. On the other, automotive finance, after-sales repair, insurance and extended warranties, fleet management, and subscription services can generate recurring revenue from the installed vehicle base, service frequency, and customer renewal, providing the downstream segment with a relatively stable cash-flow foundation.
Automotive-finance demand remained supported, but funding costs, credit quality, and vehicle residual-value risk limited earnings elasticity. Platforms with stable funding sources, prudent risk pricing, high-quality customer bases, and mature post-loan management were relatively better positioned. Loan-book growth alone is insufficient evidence of commensurate profit growth.
Mobility platforms and automotive services continued to shift from scale expansion toward earnings delivery. Mature platforms improved monetization through order frequency, membership, advertising, and asset-light networks. Robotaxi, low-altitude mobility, and eVTOL remained in testing, certification, and demonstration-operation stages, making their valuations more sensitive to formal approvals, order quality, funding reserves, and cash burn.
Charging, energy services, and energy storage continued to expand as infrastructure businesses, but earnings improvement remained dependent on utilization and return on capital. Charging networks benefited from the growing EV installed base, but site quality, electricity costs, service fees, and depreciation determine unit-level charging economics. Energy-storage projects still need to validate grid dispatch, pricing mechanisms, and financing costs.
Looking ahead to the second half of 2026, pricing of the Service Index is expected to remain centered on earnings delivery. If monetary and credit conditions improve at the margin, automotive finance, fleet operations, and platform services may receive valuation support. Charging, energy storage, and frontier mobility will still need to validate growth expectations through utilization, project returns, regulatory progress, and commercial revenue.
Portfolio allocation across these segments should balance cash-flow certainty with long-term growth. Automotive finance should be assessed on funding costs, credit underwriting, and write-off control; platforms and automotive services on user retention, free cash flow, and profitability after subsidies are withdrawn; charging and energy storage on high-quality sites, long-term contracts, and capital discipline; and frontier mobility on formal certification, customer payments, production ramp-up, and funding reserves.

Five Pivotal Roles Orchestrating
Glocal Organization Integration

Escaping the Value Trap
in the Intelligent Driving Era

Value Reimagined:
Automotive Industry Outlook 2026
Momentum Diverges; Realization Ascends as the New Governing Order:
26H1 Review & Prospect
Sep 16, 2026
Navigating industry transformation and value realignment, reviewing H1 2026 performance and evolving earnings dynamics across future mobility, while identifying value shifts and structural opportunities for the second half of the year.
[2026 H1 in a Nutshell]
• Primary Index: The index closed at 1,446.36 points, down 5.07% for 2026 H1. Gains of 5.53% in upstream and 6.83% in services proved insufficient to offset a 19.92% correction in manufacturing, as industry pricing logic shifted from scale expansion toward earnings realization.
• Secondary Index: Upstream remains supported by resource supply dynamics and an energy-security premium; services have been re-rated on recurring revenue and commercialization visibility. Manufacturing, by contrast, is absorbing a structural "scale discount" under converging pressure from price competition, inventory burden, and capex discipline — the principal drag on the primary index.
• Constituent Stocks: Market preference has moved from breadth of exposure to demonstrated delivery capability. Bellwethers are concentrated in materials, semiconductors, specialty equipment, and intelligent detection. High-value names are anchored in global commercial vehicles, electrification, and integrated energy platforms. Growth names remain centered on OEMs, edge computing, and mobility networks, though increasingly contingent on validated unit economics..
• Macroeconomic Trends: The Middle East conflict is compressing long-duration asset valuations via the oil price–inflation–discount rate channel. China reflects subdued domestic demand, export-led support, and structural upgrading; European electrification demand remains resilient amid rising localization thresholds; North America is rebalancing following subsidy step-down.
• Industry Operations: The industry is moving from a contest of penetration rates to a verification of returns on capital. Volume, share, and exports remain foundational to growth, but price discipline, platform-level cost reduction, software monetization, overseas localization profitability, and free cash flow now jointly determine valuation.
[2026 H2 Outlook]
• Primary Index: Under the base case, the index enters a phase of "structural rotation rather than synchronized ascent," with oil prices and real interest rates continuing to function as the master valve on valuation. Should cost pressures abate, manufacturing retains meaningful recovery elasticity; should the high-cost environment persist, upstream and services should continue to command leadership.
• Secondary Index: The value chain advances into a phase of asynchronous realization, with the locus of value increasingly well-defined. The upstream sector turns on the cost curve and supply discipline; the midstream sector on price order, inventory discipline, and return on unit capital; the downstream sector on per-vehicle utilization, paid mileage, cash burn, and the efficiency of city-by-city replication.
• Constituent Stocks: Capital continues to concentrate around verifiable certainty. High-value companies anchor their base through supply chain leverage, global channel reach, and cash flow buffers, consolidating their dominant positions. Bellwether companies must underwrite re-rating with delivered profitability. Growth companies face the imperative of converting technological advantage into scaled revenue and demonstrable unit economics.
• Macroeconomic Trends: Global demand dynamics will be shaped by the interplay of oil prices and interest rates as the principal determinant of the risk premium. China's automotive price order, European tariff and localization costs, and the post-subsidy demand equilibrium in North America will jointly determine regional profitability; exports continue to furnish incremental upside, though rising compliance burden and capital intensity will accelerate divergence among companies.
• Industry Operations: Competitive advantage continues its shift from product specification and delivery scale toward platform efficiency and full-lifecycle value. Companies capable of reducing R&D and manufacturing complexity, expanding software and services revenue, and establishing a profitable closed loop overseas are best positioned to command a durable premium.
Looking back on the first half of 2026, the PRMC Forward Mobility Index closed at 1,446.36 points, down 5.07% from the start of the year. This correction does not reflect market rejection of the electrification and intelligence trends; rather, it signals a re-examination of the linear assumption that rising penetration necessarily translates into profit expansion across the entire value chain:
First, the macro cycle has elevated discounting pressure. The Middle East conflict is compressing the valuation of long-duration assets via the transmission channel of oil prices, inflation, and interest rate expectations. Concurrently, subdued domestic demand in China, rising localization thresholds in Europe, and subsidy step-down in North America are further differentiating the quality of growth across regions.
Second, the earnings cycle has begun to dominate pricing. New energy vehicles and exports continue to grow, but price competition, inventory burden, and capex constraints have weakened profit transmission at the manufacturing end. The upstream and services indices rose 5.53% and 6.83% respectively, while the manufacturing index declined 19.92% — driving a shift in valuation logic from scale expansion toward earnings realization and return on capital.
Correspondingly, the secondary indices have exhibited value rebalancing along the chain. Upstream is buoyed by resource supply dynamics and an energy-security premium; midstream is absorbing a scale discount amid price competition; downstream commands a relative premium on the strength of recurring revenue, operational efficiency, and commercialization visibility.
As divergence deepens, the market's screening criteria have shifted from track coverage to delivery density. Investors are increasingly focused on whether companies can convert revenue growth into profit and free cash flow, and whether global channel reach, localized operations, and supply chain control can enhance resilience to volatility. Under this logic, Leading Performers such as Defu Technology, Intel, STMicroelectronics, Nichirei Tech, and AMD emerged as representative beneficiaries of the market's H1 re-rating.
From a macro perspective, corporate divergence has been further amplified by external variables. Energy prices, real interest rates, and regional demand misalignment are shaping the pace of automotive consumption and valuation; meanwhile, tariffs, subsidy adjustments, rules of origin, and localization requirements are redrawing the boundaries of global supply chains — directly reshaping companies' cost curves, product portfolios, and paths to overseas expansion.
At the industry level, the defining inflection of H1 2026 is the transition from a "penetration-rate race" to a "return-on-capital verification" phase. Volume, share, and exports remain the growth chassis, but price discipline, platform-level cost reduction, software monetization, offshore localization profitability, and free cash flow are now jointly determining operating quality and valuation centers.
Looking ahead to 2026 H2, the index may transition from the deep divergence of H1 toward structural rotation. Energy prices and real interest rates remain the master valve on valuation, while trade barriers, industry regulation, and regional policy further shape the risk premium. Market tolerance for forward-looking narrative is declining, and pricing gravity is concentrating on earnings quality, cash flow resilience, and pace of realization.
Accordingly, index upside is more likely to emerge from valuation stability underpinned by earnings certainty than from sentiment-driven broad-based expansion. Companies able to sustain profit and free cash flow through cost, demand, and policy volatility will be the primary source of index resilience.
Rebalancing across the secondary indices will shift from phased divergence to asynchronous realization. Upstream turns on the cost curve and supply discipline; midstream on price order, inventory improvement, and return on unit capital; downstream on per-vehicle utilization, paid mileage, cash burn, and city-by-city replication efficiency — each segment seeking re-rating along its own operating cycle.
Stock-level competition will be further reconfigured. High-value names — ABB, Eaton, Daimler Truck, PTT, and O'Reilly Automotive among them — draw on supply chain leverage, global channel reach, and cash flow buffers to sustain operating stability through volatility, with capital discipline poised to consolidate their positions further.
Growth names — CATL, NVIDIA, Tesla, Uber, and ACV Auctions among them — must convert technological, platform, or network advantage into scaled revenue and demonstrable unit economics. The defining question is no longer conceptual leadership, but whether commercialization pace can match valuation expectations.
Survival pressure on mid- and lower-tier companies will continue to build, as financing costs, price competition, compliance spend, and capex jointly compress cash flow headroom — leaving those without differentiation, cost advantage, or stable funding exposed in the coming consolidation.
From a macro perspective, regional conditions remain divergent: emerging markets retain headroom for motorization; European electrification demand persists amid rising tariffs and localization thresholds; North American demand stays constrained by rates and subsidy adjustment; and Asia's supply chain advantage is evolving from cost efficiency toward industrial coordination and global operational reach.
Industry competition in H2 resembles a low-intensity, long-cycle contest of efficiency. Price competition persists more implicitly, pressuring low-end profitability, while the mid-to-high end contests pricing power around intelligent experience, powertrain efficiency, safety, comfort, and brand — with systemic value outweighing individual specifications.
At the industry level, exports and overseas expansion are being elevated from a volume lever to a hedge against cyclicality and a driver of structural optimization — their value lying not just in capacity utilization, but in building a regional profit closed-loop through local manufacturing, channels, service, and compliance. High-quality globalization is shifting from export scale toward the sustained realization of brand, profit, and organizational capability.

Shanghai
11/F · WSH Building
POLY GREENLAND PLAZA
198 Jingzhou Road
Shanghai PRC · 200082
London
OFFICE SUITE 29A · 3/F
23 Wharf Street
London England · SE8 3GG
Hongkong
9/F · Tower A
NEW MANDARIN PLAZA
14 Science Museum Road
Hongkong SAR · 999077