

Momentum Diverges; Realization Ascends as the New Governing Order:
26H1 Review & Prospect
Momentum Diverges; Realization Ascends as the New Governing Order:
26H1 Review & Prospect


Momentum Diverges; Realization Ascends as the New Governing Order:
26H1 Review & Prospect
Sep 16, 2026
Navigating industry transformation and value realignment, reviewing H1 2026 performance and evolving earnings dynamics across future mobility, while identifying value shifts and structural opportunities for the second half of the year.
[2026 H1 in a Nutshell]
• Primary Index: The index closed at 1,446.36 points, down 5.07% for 2026 H1. Gains of 5.53% in upstream and 6.83% in services proved insufficient to offset a 19.92% correction in manufacturing, as industry pricing logic shifted from scale expansion toward earnings realization.
• Secondary Index: Upstream remains supported by resource supply dynamics and an energy-security premium; services have been re-rated on recurring revenue and commercialization visibility. Manufacturing, by contrast, is absorbing a structural "scale discount" under converging pressure from price competition, inventory burden, and capex discipline — the principal drag on the primary index.
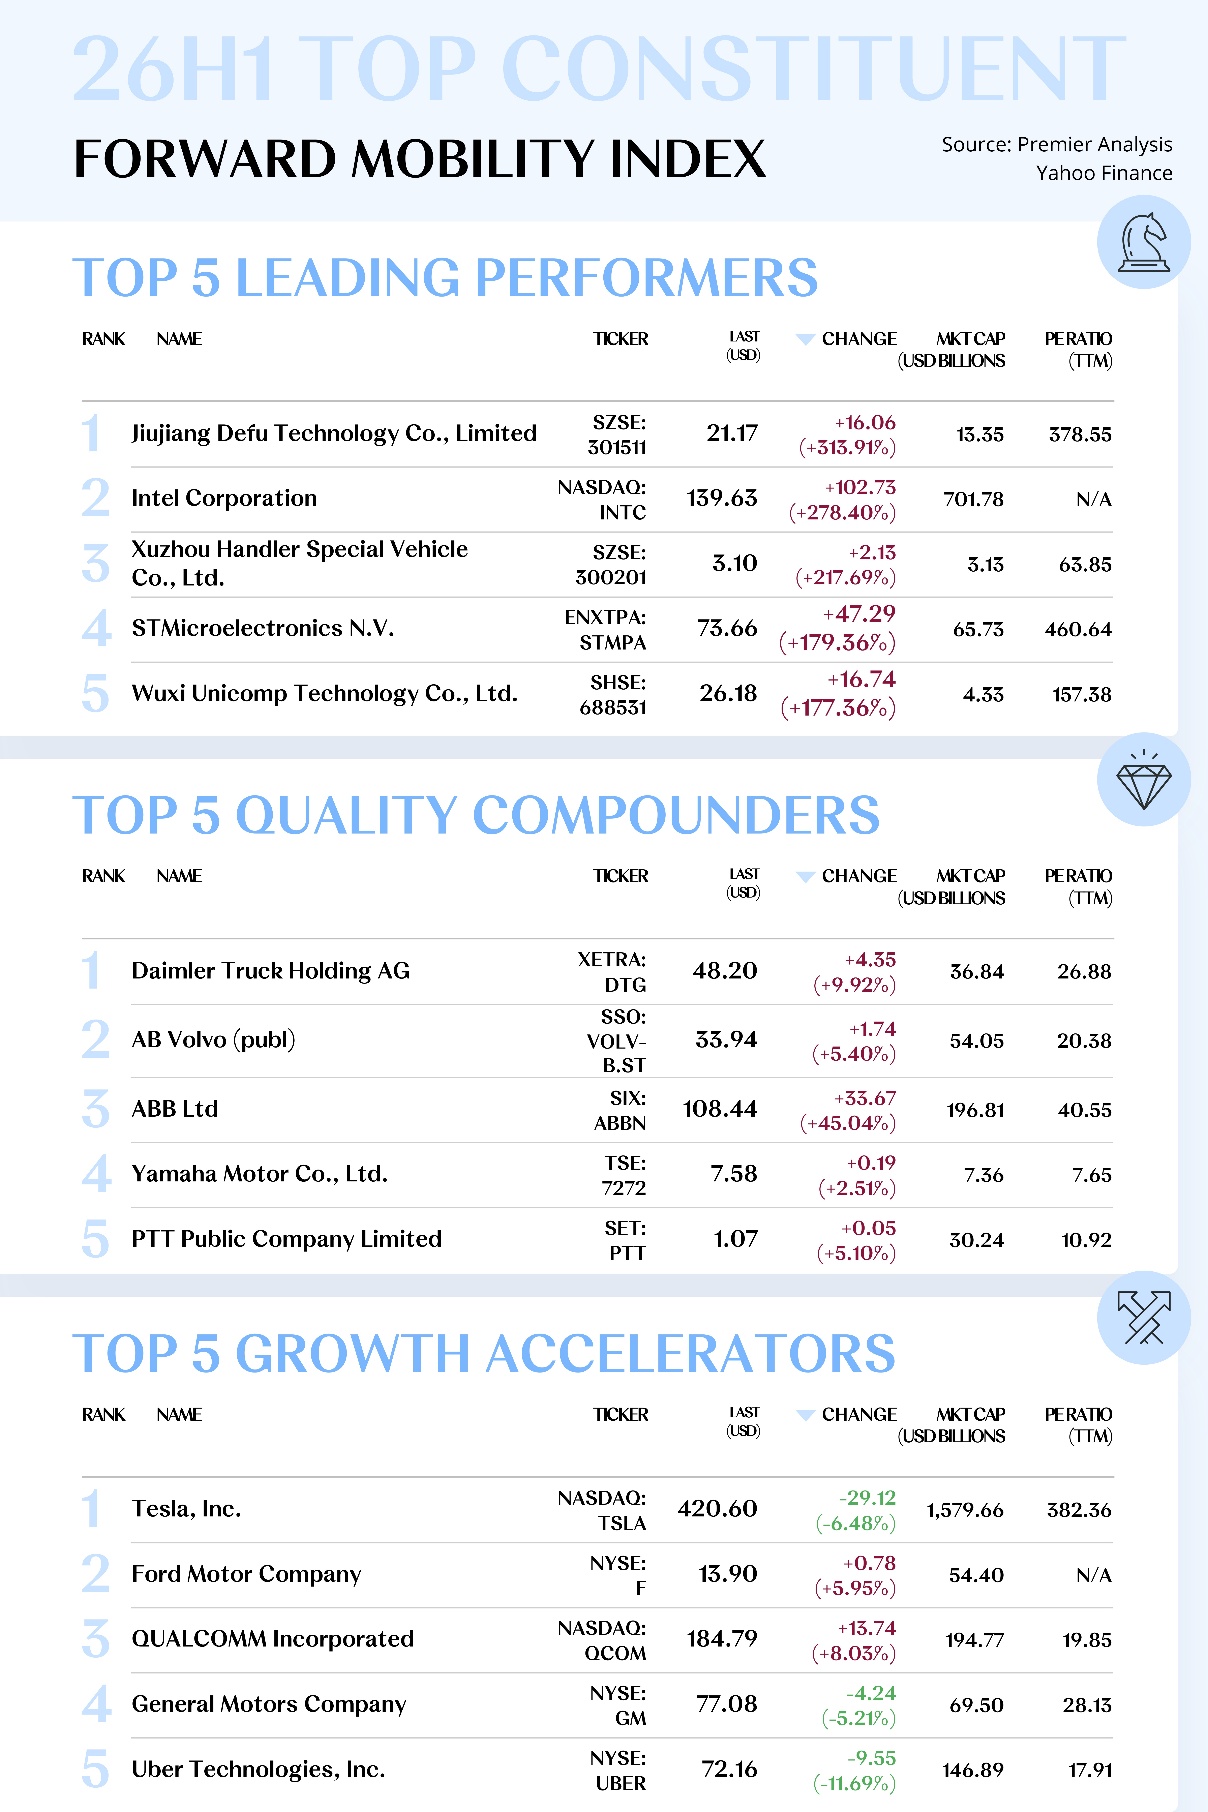
• Constituent Stocks: Market preference has moved from breadth of exposure to demonstrated delivery capability. Bellwethers are concentrated in materials, semiconductors, specialty equipment, and intelligent detection. High-value names are anchored in global commercial vehicles, electrification, and integrated energy platforms. Growth names remain centered on OEMs, edge computing, and mobility networks, though increasingly contingent on validated unit economics..
• Macroeconomic Trends: The Middle East conflict is compressing long-duration asset valuations via the oil price–inflation–discount rate channel. China reflects subdued domestic demand, export-led support, and structural upgrading; European electrification demand remains resilient amid rising localization thresholds; North America is rebalancing following subsidy step-down.
• Industry Operations: The industry is moving from a contest of penetration rates to a verification of returns on capital. Volume, share, and exports remain foundational to growth, but price discipline, platform-level cost reduction, software monetization, overseas localization profitability, and free cash flow now jointly determine valuation.
[2026 H2 Outlook]
• Primary Index: Under the base case, the index enters a phase of "structural rotation rather than synchronized ascent," with oil prices and real interest rates continuing to function as the master valve on valuation. Should cost pressures abate, manufacturing retains meaningful recovery elasticity; should the high-cost environment persist, upstream and services should continue to command leadership.
• Secondary Index: The value chain advances into a phase of asynchronous realization, with the locus of value increasingly well-defined. The upstream sector turns on the cost curve and supply discipline; the midstream sector on price order, inventory discipline, and return on unit capital; the downstream sector on per-vehicle utilization, paid mileage, cash burn, and the efficiency of city-by-city replication.
• Constituent Stocks: Capital continues to concentrate around verifiable certainty. High-value companies anchor their base through supply chain leverage, global channel reach, and cash flow buffers, consolidating their dominant positions. Bellwether companies must underwrite re-rating with delivered profitability. Growth companies face the imperative of converting technological advantage into scaled revenue and demonstrable unit economics.
• Macroeconomic Trends: Global demand dynamics will be shaped by the interplay of oil prices and interest rates as the principal determinant of the risk premium. China's automotive price order, European tariff and localization costs, and the post-subsidy demand equilibrium in North America will jointly determine regional profitability; exports continue to furnish incremental upside, though rising compliance burden and capital intensity will accelerate divergence among companies.
• Industry Operations: Competitive advantage continues its shift from product specification and delivery scale toward platform efficiency and full-lifecycle value. Companies capable of reducing R&D and manufacturing complexity, expanding software and services revenue, and establishing a profitable closed loop overseas are best positioned to command a durable premium.
Looking back on the first half of 2026, the PRMC Forward Mobility Index closed at 1,446.36 points, down 5.07% from the start of the year. This correction does not reflect market rejection of the electrification and intelligence trends; rather, it signals a re-examination of the linear assumption that rising penetration necessarily translates into profit expansion across the entire value chain:
First, the macro cycle has elevated discounting pressure. The Middle East conflict is compressing the valuation of long-duration assets via the transmission channel of oil prices, inflation, and interest rate expectations. Concurrently, subdued domestic demand in China, rising localization thresholds in Europe, and subsidy step-down in North America are further differentiating the quality of growth across regions.
Second, the earnings cycle has begun to dominate pricing. New energy vehicles and exports continue to grow, but price competition, inventory burden, and capex constraints have weakened profit transmission at the manufacturing end. The upstream and services indices rose 5.53% and 6.83% respectively, while the manufacturing index declined 19.92% — driving a shift in valuation logic from scale expansion toward earnings realization and return on capital.
Correspondingly, the secondary indices have exhibited value rebalancing along the chain. Upstream is buoyed by resource supply dynamics and an energy-security premium; midstream is absorbing a scale discount amid price competition; downstream commands a relative premium on the strength of recurring revenue, operational efficiency, and commercialization visibility.
As divergence deepens, the market's screening criteria have shifted from track coverage to delivery density. Investors are increasingly focused on whether companies can convert revenue growth into profit and free cash flow, and whether global channel reach, localized operations, and supply chain control can enhance resilience to volatility. Under this logic, Leading Performers such as Defu Technology, Intel, STMicroelectronics, Nichirei Tech, and AMD emerged as representative beneficiaries of the market's H1 re-rating.
From a macro perspective, corporate divergence has been further amplified by external variables. Energy prices, real interest rates, and regional demand misalignment are shaping the pace of automotive consumption and valuation; meanwhile, tariffs, subsidy adjustments, rules of origin, and localization requirements are redrawing the boundaries of global supply chains — directly reshaping companies' cost curves, product portfolios, and paths to overseas expansion.
At the industry level, the defining inflection of H1 2026 is the transition from a "penetration-rate race" to a "return-on-capital verification" phase. Volume, share, and exports remain the growth chassis, but price discipline, platform-level cost reduction, software monetization, offshore localization profitability, and free cash flow are now jointly determining operating quality and valuation centers.
Looking ahead to 2026 H2, the index may transition from the deep divergence of H1 toward structural rotation. Energy prices and real interest rates remain the master valve on valuation, while trade barriers, industry regulation, and regional policy further shape the risk premium. Market tolerance for forward-looking narrative is declining, and pricing gravity is concentrating on earnings quality, cash flow resilience, and pace of realization.
Accordingly, index upside is more likely to emerge from valuation stability underpinned by earnings certainty than from sentiment-driven broad-based expansion. Companies able to sustain profit and free cash flow through cost, demand, and policy volatility will be the primary source of index resilience.
Rebalancing across the secondary indices will shift from phased divergence to asynchronous realization. Upstream turns on the cost curve and supply discipline; midstream on price order, inventory improvement, and return on unit capital; downstream on per-vehicle utilization, paid mileage, cash burn, and city-by-city replication efficiency — each segment seeking re-rating along its own operating cycle.
Stock-level competition will be further reconfigured. High-value names — ABB, Eaton, Daimler Truck, PTT, and O'Reilly Automotive among them — draw on supply chain leverage, global channel reach, and cash flow buffers to sustain operating stability through volatility, with capital discipline poised to consolidate their positions further.
Growth names — CATL, NVIDIA, Tesla, Uber, and ACV Auctions among them — must convert technological, platform, or network advantage into scaled revenue and demonstrable unit economics. The defining question is no longer conceptual leadership, but whether commercialization pace can match valuation expectations.
Survival pressure on mid- and lower-tier companies will continue to build, as financing costs, price competition, compliance spend, and capex jointly compress cash flow headroom — leaving those without differentiation, cost advantage, or stable funding exposed in the coming consolidation.
From a macro perspective, regional conditions remain divergent: emerging markets retain headroom for motorization; European electrification demand persists amid rising tariffs and localization thresholds; North American demand stays constrained by rates and subsidy adjustment; and Asia's supply chain advantage is evolving from cost efficiency toward industrial coordination and global operational reach.
Industry competition in H2 resembles a low-intensity, long-cycle contest of efficiency. Price competition persists more implicitly, pressuring low-end profitability, while the mid-to-high end contests pricing power around intelligent experience, powertrain efficiency, safety, comfort, and brand — with systemic value outweighing individual specifications.
At the industry level, exports and overseas expansion are being elevated from a volume lever to a hedge against cyclicality and a driver of structural optimization — their value lying not just in capacity utilization, but in building a regional profit closed-loop through local manufacturing, channels, service, and compliance. High-quality globalization is shifting from export scale toward the sustained realization of brand, profit, and organizational capability.
DOWNLOADS

Lite Report (103 pages)
Related Articles

Five Pivotal Roles Orchestrating
Glocal Organization Integration

Escaping the Value Trap
in the Intelligent Driving Era

Value Reimagined:
Automotive Industry Outlook 2026

Shanghai
11/F · WSH Building
POLY GREENLAND PLAZA
198 Jingzhou Road
Shanghai PRC · 200082
London
OFFICE SUITE 29A · 3/F
23 Wharf Street
London England · SE8 3GG
Hongkong
9/F · Tower A
NEW MANDARIN PLAZA
14 Science Museum Road
Hongkong SAR · 999077