
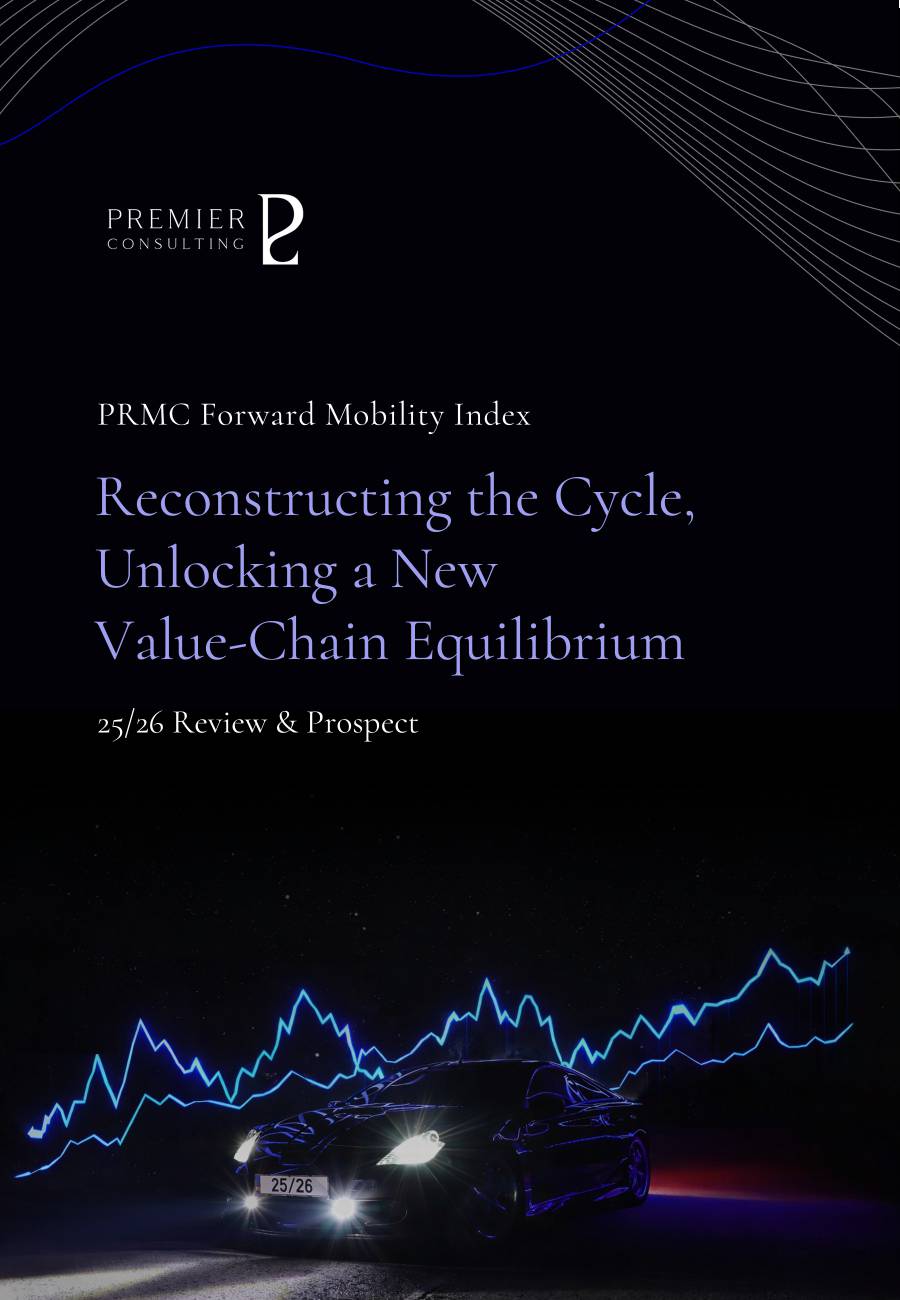
Reconstructing the Cycle, Unlocking a New Value-Chain Equilibrium:
25/26 PRMC Forward Mobility Index Review & Prospect
Reconstructing the Cycle, Unlocking a New Value-Chain Equilibrium:
25/26 PRMC Forward Mobility Index Review & Prospect
To help investors and industry professionals stay balanced amid disruption and act with foresight amid long-term shifts, uphold a long-term investment philosophy, reflect on the key trends of 2025, and capture structural opportunities in the automotive sector of future mobility in 2026.
[2025 in a Nutshell]
• Primary Index: Under the combined influence of the "policy cycle + technology cycle" the index maintained a recovery trend throughout the year. Domestic and foreign policies have supported improved demand expectations, while technological iteration has determined industry discourse power and valuation centers.
• Secondary Index: The secondary index has exhibited rebalancing along the supply chain. The upstream sector is more strongly influenced by resource prices and supply-demand cycles. The midstream manufacturing sector faces pressure from price competition; however, leading companies are stabilizing profitability through efficiency and scale. The downstream channels and services demonstrate long-term resilience driven by replacement cycles, finance, and after-sales ecosystems.
• Constituent Stocks: Market preference for "delivery capability" has significantly increased. Delivery volume and market share are no longer the only metrics; profitability, expense ratios, cash flow, overseas channels, and supply chain control profoundly influence corporate valuations.
• Macroeconomic Trends: A "regional divergence" is observed, with discrepancies in manufacturing cycles and consumption resilience among different economies, resulting in asynchronous recovery in automobile demand. The evolving trade environment and industrial policies are reshaping global supply chains, with tariffs, origin rules, subsidies, and entry barriers structurally overlapping.
• Industry Operations: The focus has shifted from "incremental expansion" to "stock game." Cost reduction through platformization, supply chain negotiation power, and channel efficiency have become critical dividing lines, with demand increasingly driven by the penetration of new energy sources and structural upgrades.
[2026 Outlook]
• Primary Index: Entering the "growth repricing" phase, the marginal effects of policy, overseas trade, and technological regulation collectively determine risk premiums. Opportunities for the index will increasingly arise from the certainty of profit realization rather than mere valuation expansion.
• Secondary Index: The rebalancing logic continues, with future directions becoming increasingly clear. The upstream sector focuses more on "cost curves and capacity clearance," the midstream sector emphasizes "cost reduction through platformization and product structure upgrades," while the downstream sector pays greater attention to "operational efficiency, data-driven engagement, and service subscription penetration."
• Constituent Stocks: High-quality stocks rely on established systems to hedge against cyclical volatility, consolidating their dominant positions. Growth stocks accelerate the commercialization of technology through new models, achieving elevated performance levels. Mid-tier stocks face triple pressures from financing, competition, and policy, with existential questions becoming prominent.
• Macroeconomic Trends: Global demand manifests as "structural highlights under low growth." The maneuvering space of emerging markets, the pace of electrification policies in Europe, consumption and interest rate constraints in North America, and supply chain advantages in Asia will jointly contribute to rebalancing among regions.
• Industry Operations: The domestic price war continues in a "silent" form, with the low-end market remaining under pressure, while the mid-to-high end competes for a new round of pricing power through product structure adjustments. Exports and overseas expansion will become essential strategies to hedge against fluctuations in domestic demand cycles.
Looking back at 2025, the PRMC Forward Mobility Car Index rose further on a stable foundation from the previous year. This underlying logic is not merely a recovery of risk appetite but represents an adjustment process driven by the policy cycle and technology cycle:
Firstly, Marginal support from the policy cycle. Major global economies continuously calibrate expectations between declining inflation and interest rate paths, while domestic signals for steady growth and industrial upgrading are increasingly reinforced, improving industry prosperity expectations and risk premiums in tandem.
Second, Ongoing elevation of the technology cycle. Acceleration in electrification, intelligent technology, power semiconductors, and software capabilities has shifted the competitive focus from “sales expansion” to “system capabilities and long-term winning rates.” The overlay of these two forces has allowed the index to continue its recovery amid fluctuations, anchoring the valuation center more firmly on the mainline of “technological leadership + profit realization.”
Consequently, the secondary index exhibits value rebalancing along the industrial chain. The upstream sector is driven by commodity prices and supply-demand cycles; the midstream sector tests efficiency amid competitive intensity; and the downstream sector consolidates compounding benefits through service-oriented and ecosystem approaches.
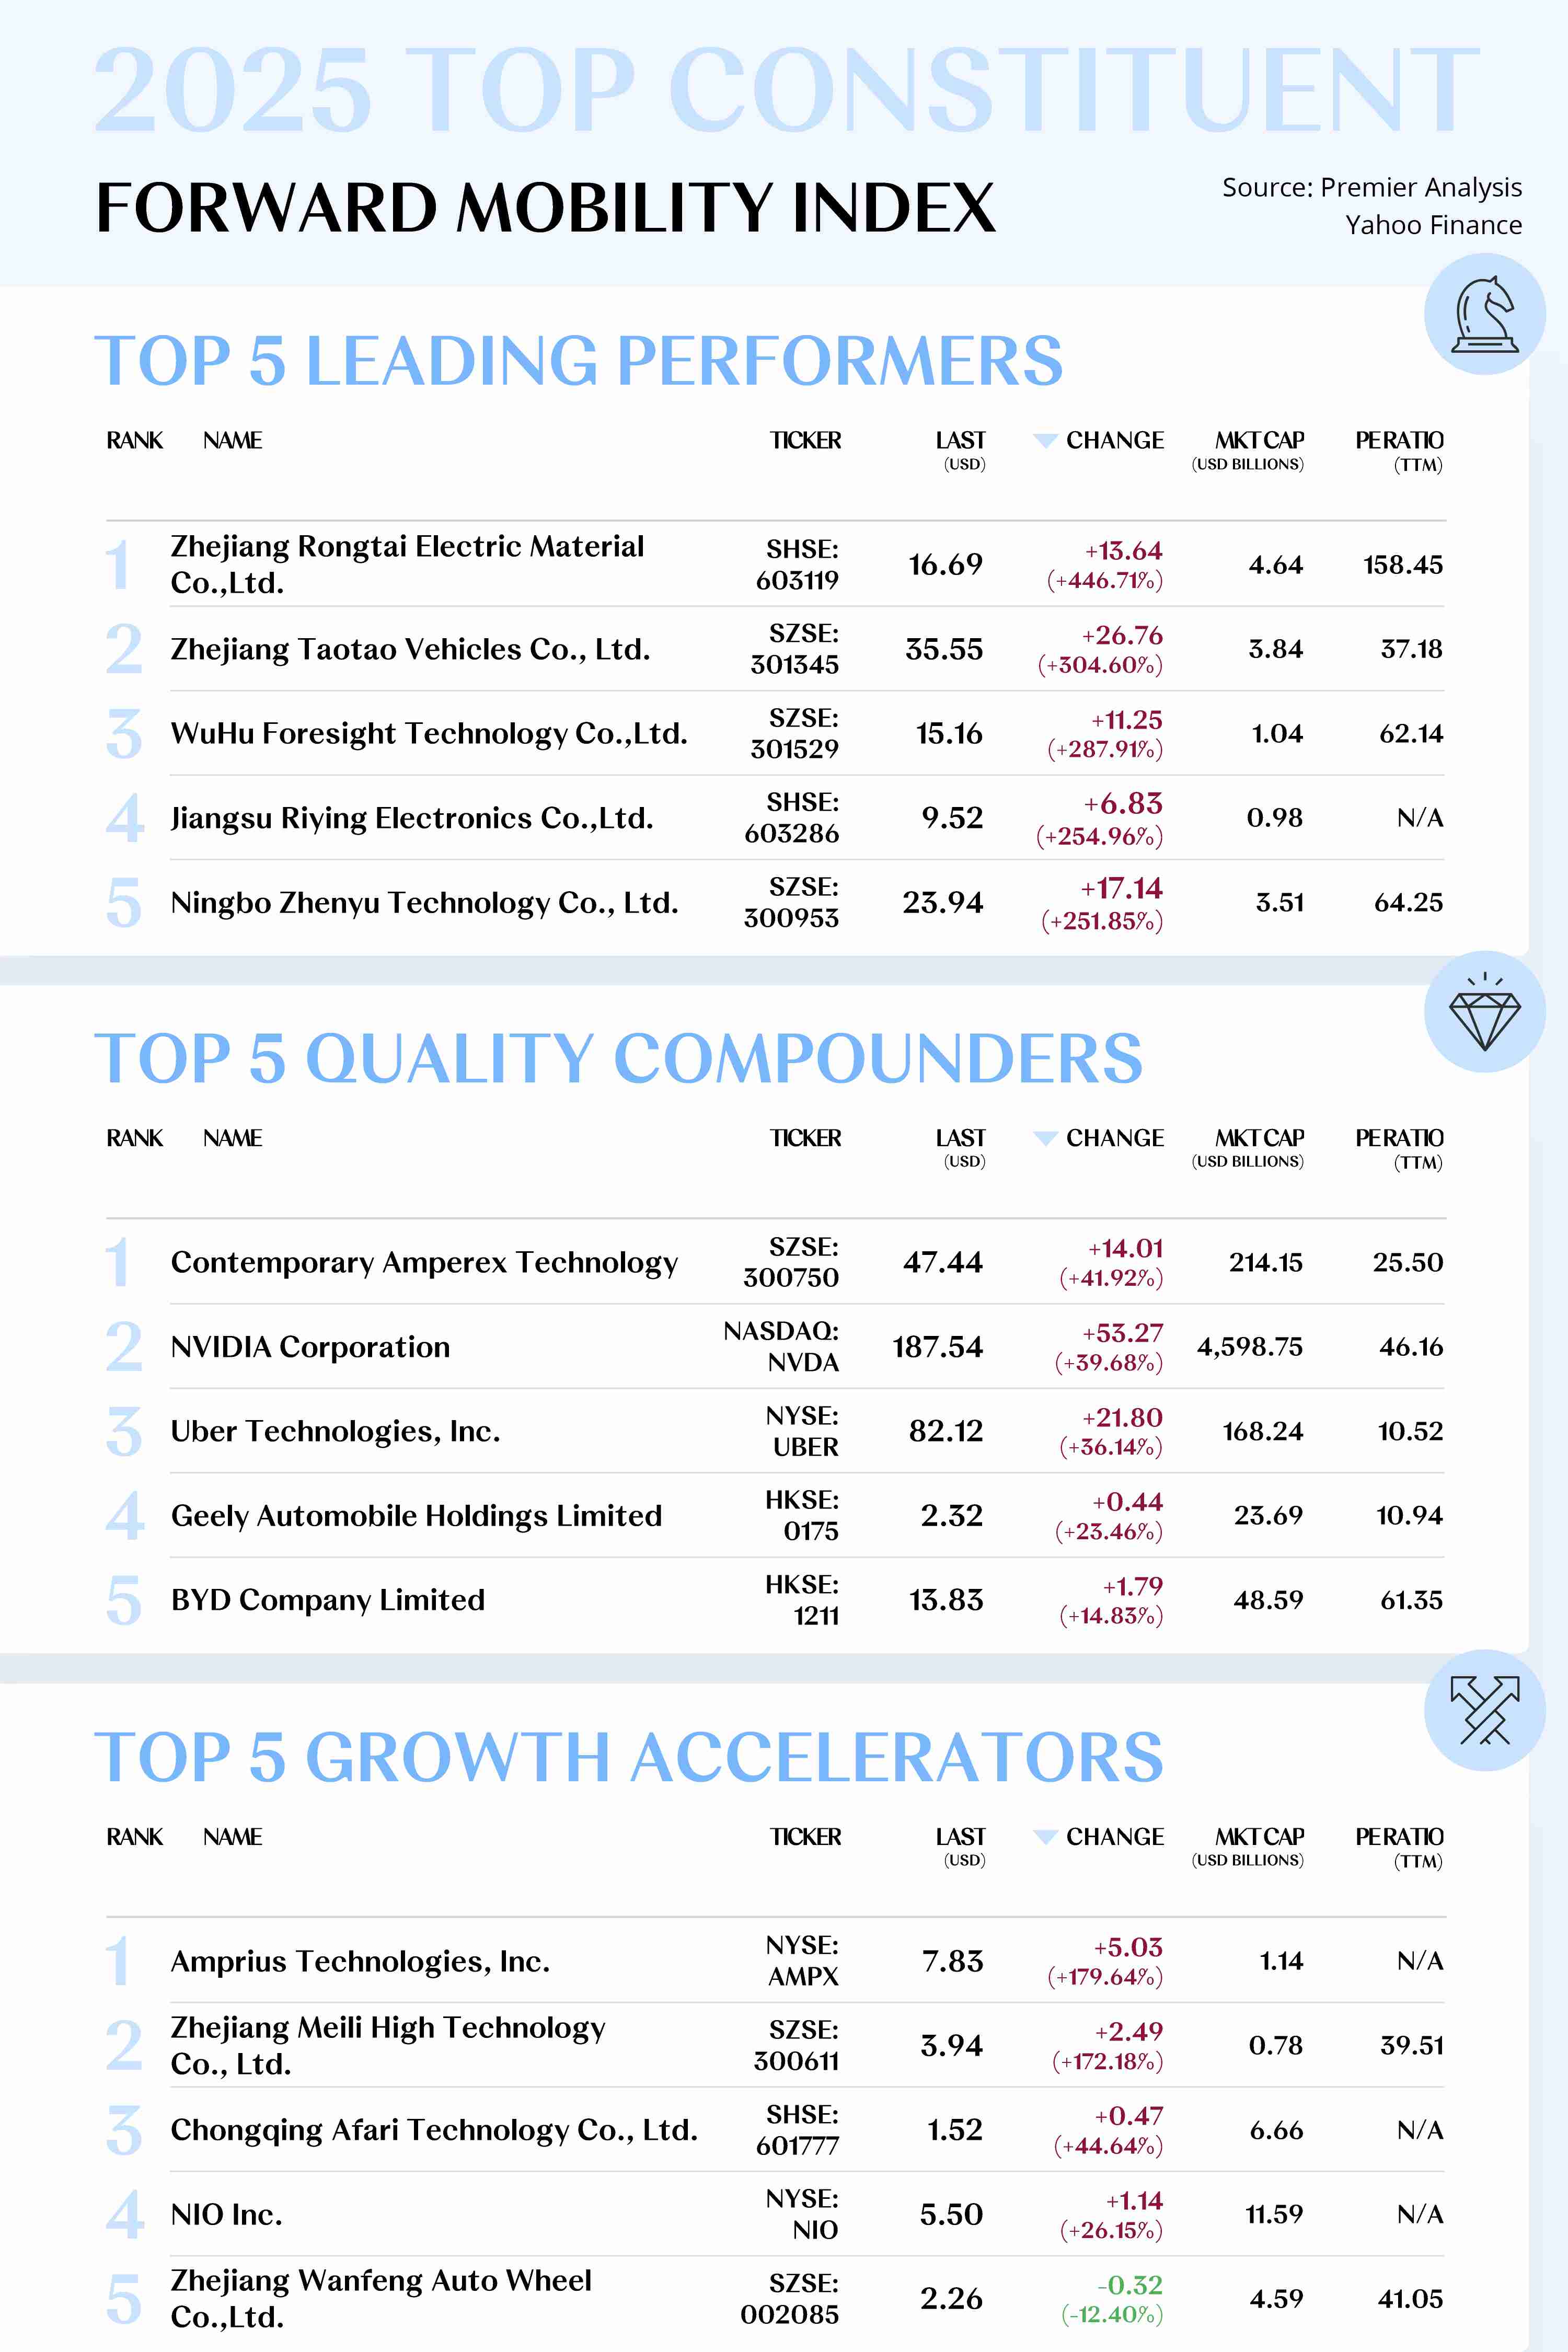
As differentiation gradually becomes evident, capital market pricing preferences contract correspondingly. The valuation logic for individual stocks has shifted from "growth narrative" to "delivery capability." Investors are increasingly concerned with whether companies can convert scale advantages into profit quality and transform growth into sustainable cash flows. At the same time, factors such as overseas channel development, localization capabilities, control over key components, and supply chain resilience are beginning to directly affect companies’ operational elasticity and stability amid changes in the external environment. Under this logic, leading performers such as Zhejiang Rongtai, Taotao Automotive, Wuhu Fuzzai, Riying Electronics, and Zhenyu Technology have emerged from the market as capital favorites.
From a macro perspective, the screening logic at the corporate level is further amplified by external variables. The manufacturing cycle and consumption resilience are misaligned between different economies, making it difficult for the recovery pace of automobile demand to be synchronized. Meanwhile, the shift in trade, environmental, and industrial policies has reshaped the boundaries of global supply chains, with tariffs, origin rules, subsidy arrangements, and entry barriers creating systematic constraints that directly impact companies' cost curves, product mix, and overseas market strategies.
At the industry level, the transition in 2025 marks the industry's shift from "incremental expansion" to the pre-phase of "stock competition": the price war continues, with demand increments increasingly derived from rising penetration of new energy and structural upgrades, while profit increments predominantly stem from product structure optimization, overseas market expansion, and the realization of full lifecycle operations (services, finance, subscriptions, and data monetization).
The overarching theme for the index in 2026 is expected to shift from “confidence recovery” to “repricing”. As marginal policy support converges, overseas trade friction persists, and technological/compliance regulations tighten, industry risk premiums will undergo systematic reassessment. The capital market's tolerance for long-term narratives will decrease, with pricing anchors becoming more focused on verifiable profitability quality, cash flow resilience, and delivery cadence.
In other words, the primary source of the index's upward movement will stem from the stability of valuation centers and structural uplift driven by “profit certainty,” rather than the broad-based valuation expansion driven by sentiment. Companies capable of consistently delivering profits and free cash flow in uncertain environments are more likely to become core contributors to the index's resilience.
Within this framework, the rebalancing of the secondary index will evolve from a phase-driven phenomenon into a normalized pattern. The core observation point for the upstream sector will be “cost curves + capacity clearance”. As supply and demand shift from a tight balance to recalibration, price and profit elasticity will revert to fundamentals. The midstream manufacturing sector remains the battleground for price competition, but the key to victory will shift from “scale expansion” to a combination of “platform-based cost reduction + product structure upgrades”. Only those leading companies that can convert scale advantages into efficiency and solidify that efficiency into profits will stabilize their gross profit floor and secure relative pricing power. The focus for downstream channels and services will center on three main lines: “enhancing operational efficiency, improving data-driven engagement capabilities, and increasing subscription penetration”. Participants who can deepen user lifecycle management and transition services and financing from one-off promotions to sustainable recurring cash flows will achieve higher elastic returns as demand rebounds.
Consequently, the competitive landscape among individual stocks will also be restructured. Quality compounders such as CATL, NVIDIA, Uber Technologies, Geely Auto, and BYD, leveraging mature supply chain systems, global layouts, and ample financial strength, can effectively hedge against cyclical risks and stabilize operational rhythms during market volatility, even capturing market share amid an overall industry contraction, further consolidating their leading positions.
Growth Accelerators such as Amprius, Mele Technology, Qianli Technology, NIO, and Wan Feng Auto Wheel will encounter more opportunities arising from the commercialization of new models and technologies. The key lies not in having more cutting-edge concepts, but in achieving faster conversions and clearer unit economic benefits. Only those enterprises capable of quickly translating technological advantages into scalable revenues and improved profit structures will possess the potential for significant performance leaps.
However, mid-tier companies face increasingly severe challenges. A tightening financing environment, intensified price competition, and stricter policies have turned cash flow and compliance costs into stringent survival constraints, making market scrutiny more direct and harsh.
From a macro perspective, emerging markets still offer room for increased mobility rates and expansion of vehicle ownership, providing sustainable incremental support for exports and international expansion. The electrification process in Europe is more driven by institutional and regulatory factors, yet the simultaneous rise in industry protectionism and compliance thresholds compels companies to adapt through more flexible power combination strategies and deeper localization efforts. North American demand remains constrained by interest rates and consumer spending, with recovery paths characterized by "slow increases and heightened differentiation“. Asia's supply chain advantages continue to be a crucial pillar for the global automotive industry; however, in the context of adjustments to trade rules and strengthened origin requirements, “supply chain advantages” are shifting from mere cost advantages to a comprehensive competitiveness anchored in industrial synergy, compliance capabilities, and global operational frameworks.
The competitive environment in 2026 will resemble a “low intensity, long cycle” battle of attrition: price competition is expected to continue in a more subtle and persistent manner, with sustained pressure on the lower-end market and profit margins being repeatedly compressed through multiple rounds of contention. The mid-to-high end market will compete for a new round of pricing power by reconstructing product structures and value systems—systemic values such as intelligent experiences, three-electric efficiency, comfort, and safety will better define premium boundaries and brand tiers than single-point parameters.
Meanwhile, export and overseas expansion will transition from being “growth options” to key levers for “cyclical hedging and structural upgrades.” Their significance lies not only in contributing to sales increases but also in enhancing capacity utilization, achieving cost dilution, and strengthening brand momentum through external expansion, while validating product and organizational capabilities in the global market.
DOWNLOADS
Lite Report (101 pages)

FM SUPPLY CONSTITUENT ZOOM-IN
Technological Innovation Driving Product Differentiation and Upgrading;
Global Market Expansion
Activating New Growth Curves
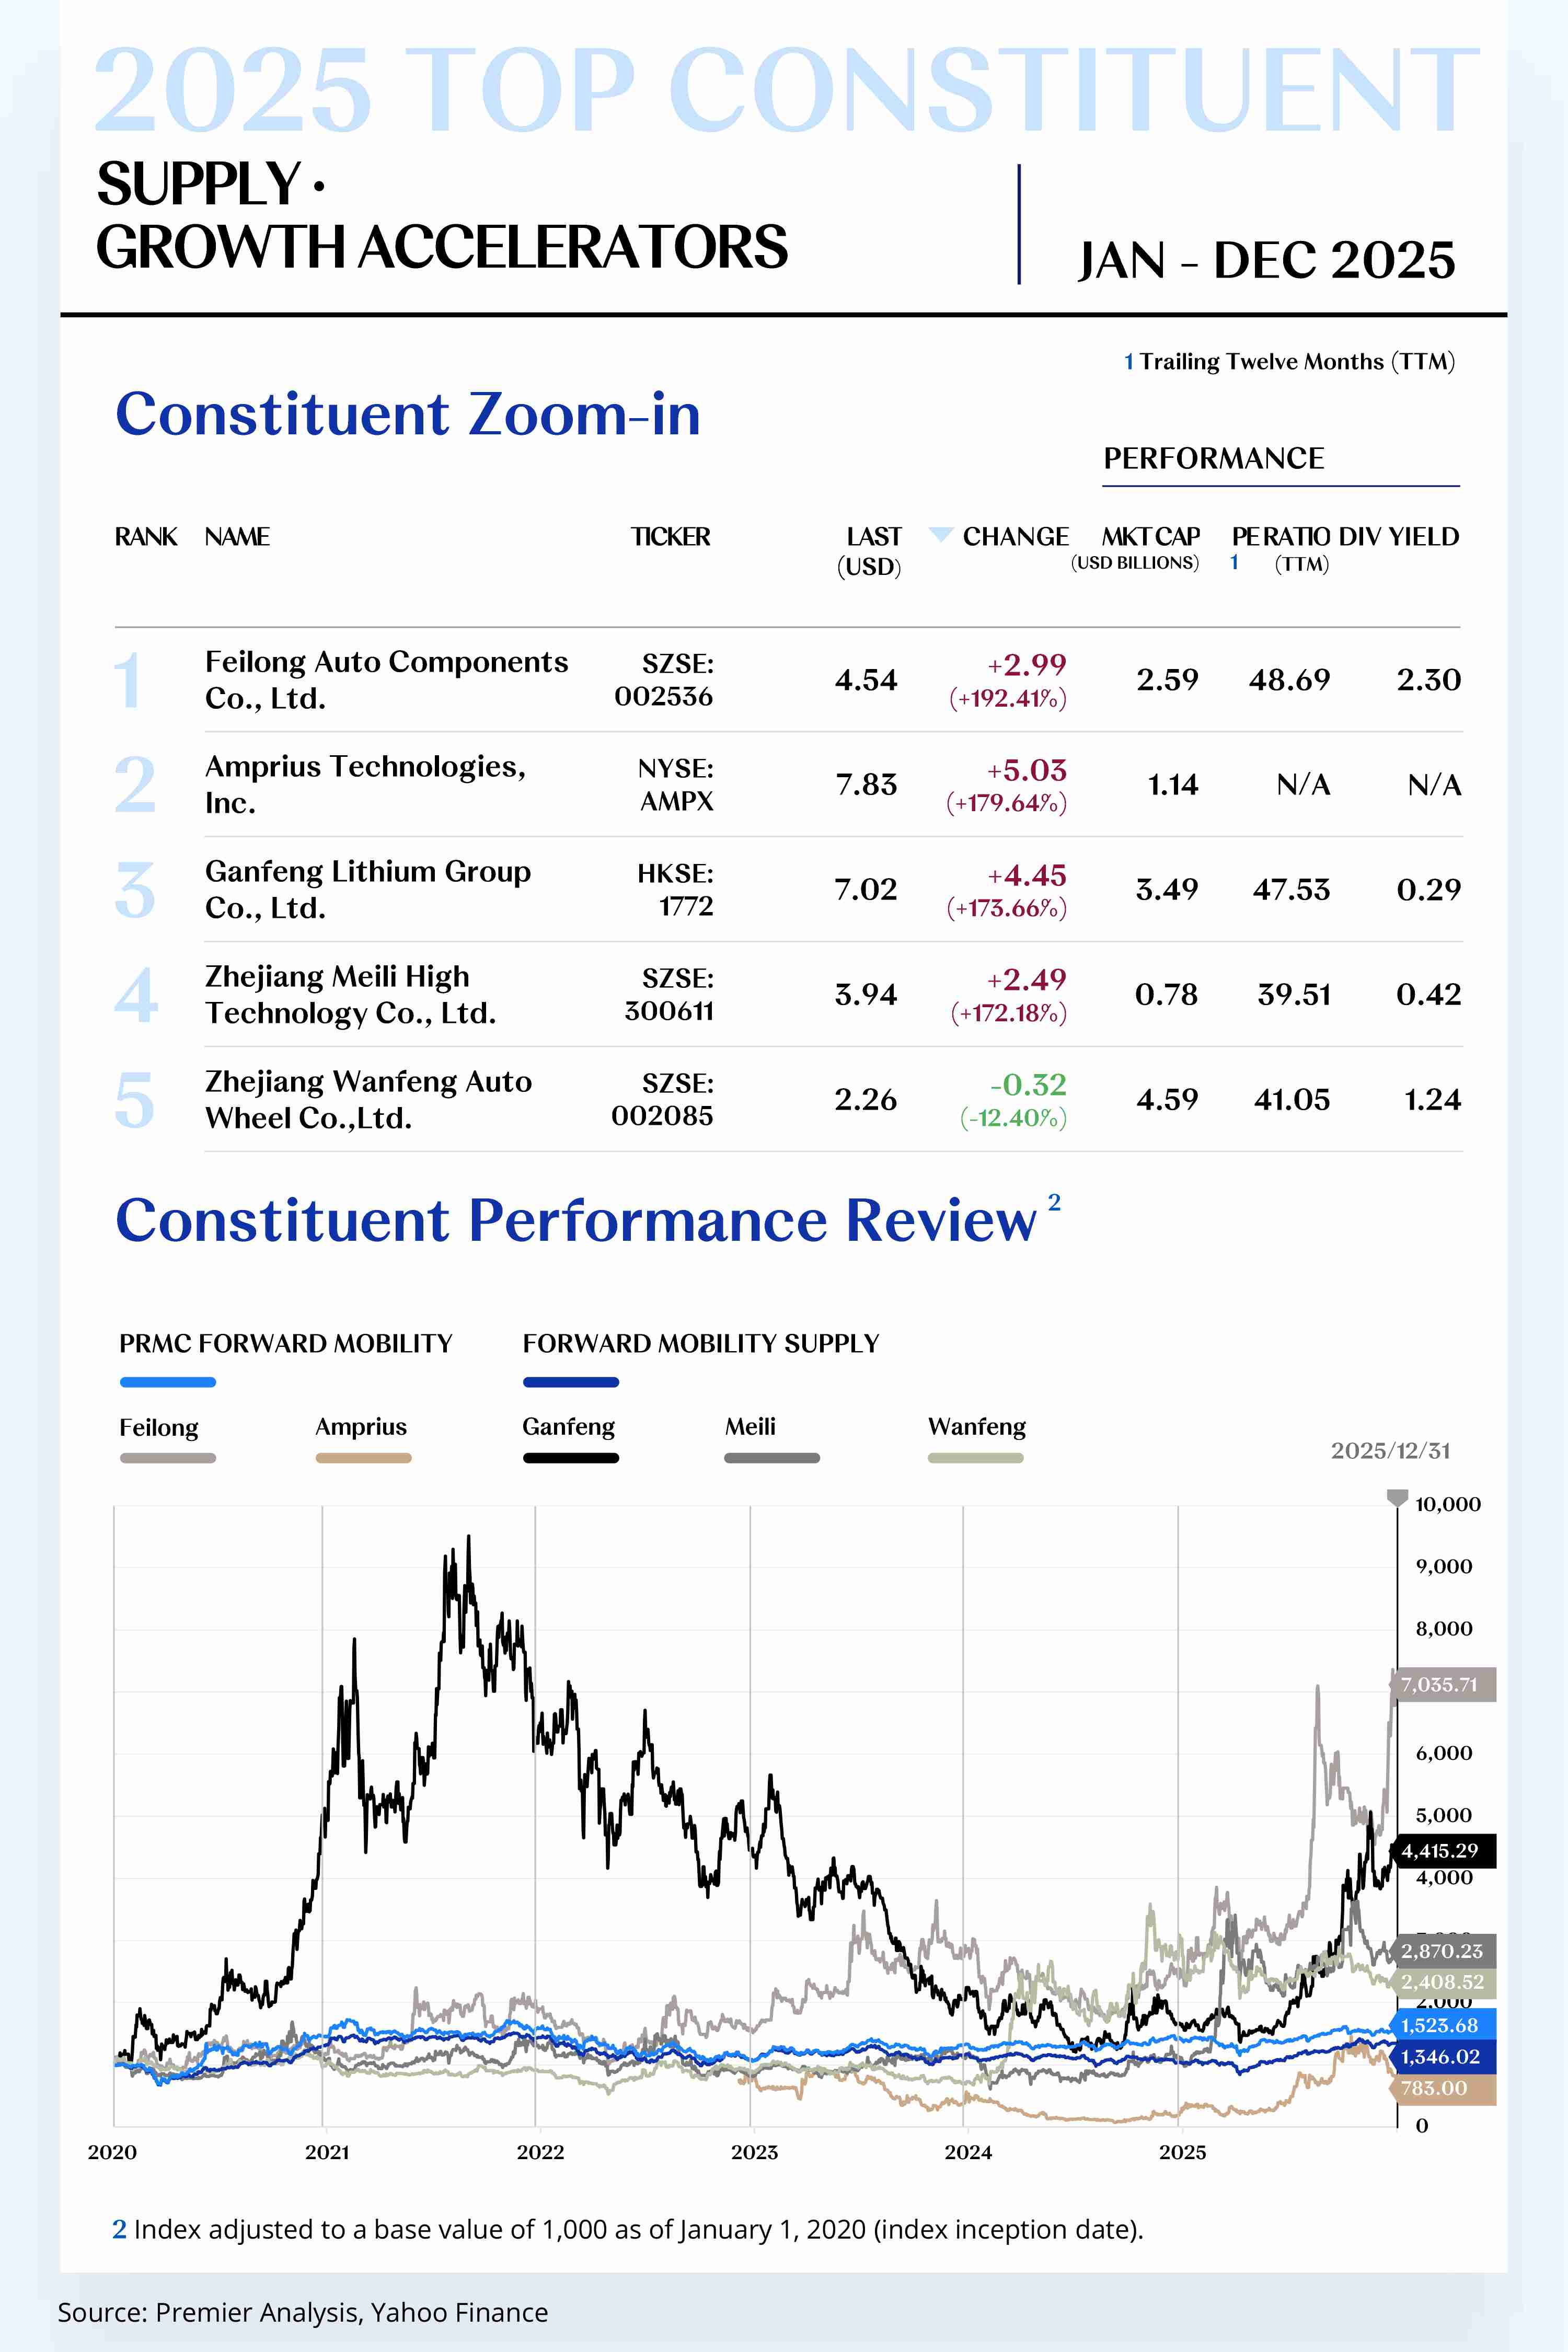
The Forward Mobility Supply Index comprises 143 stocks, with 127 rising and 16 declining.
Leading Performers
1. Zhejiang Rongtai Electric Material Co., Ltd. (SHSE: 603119)
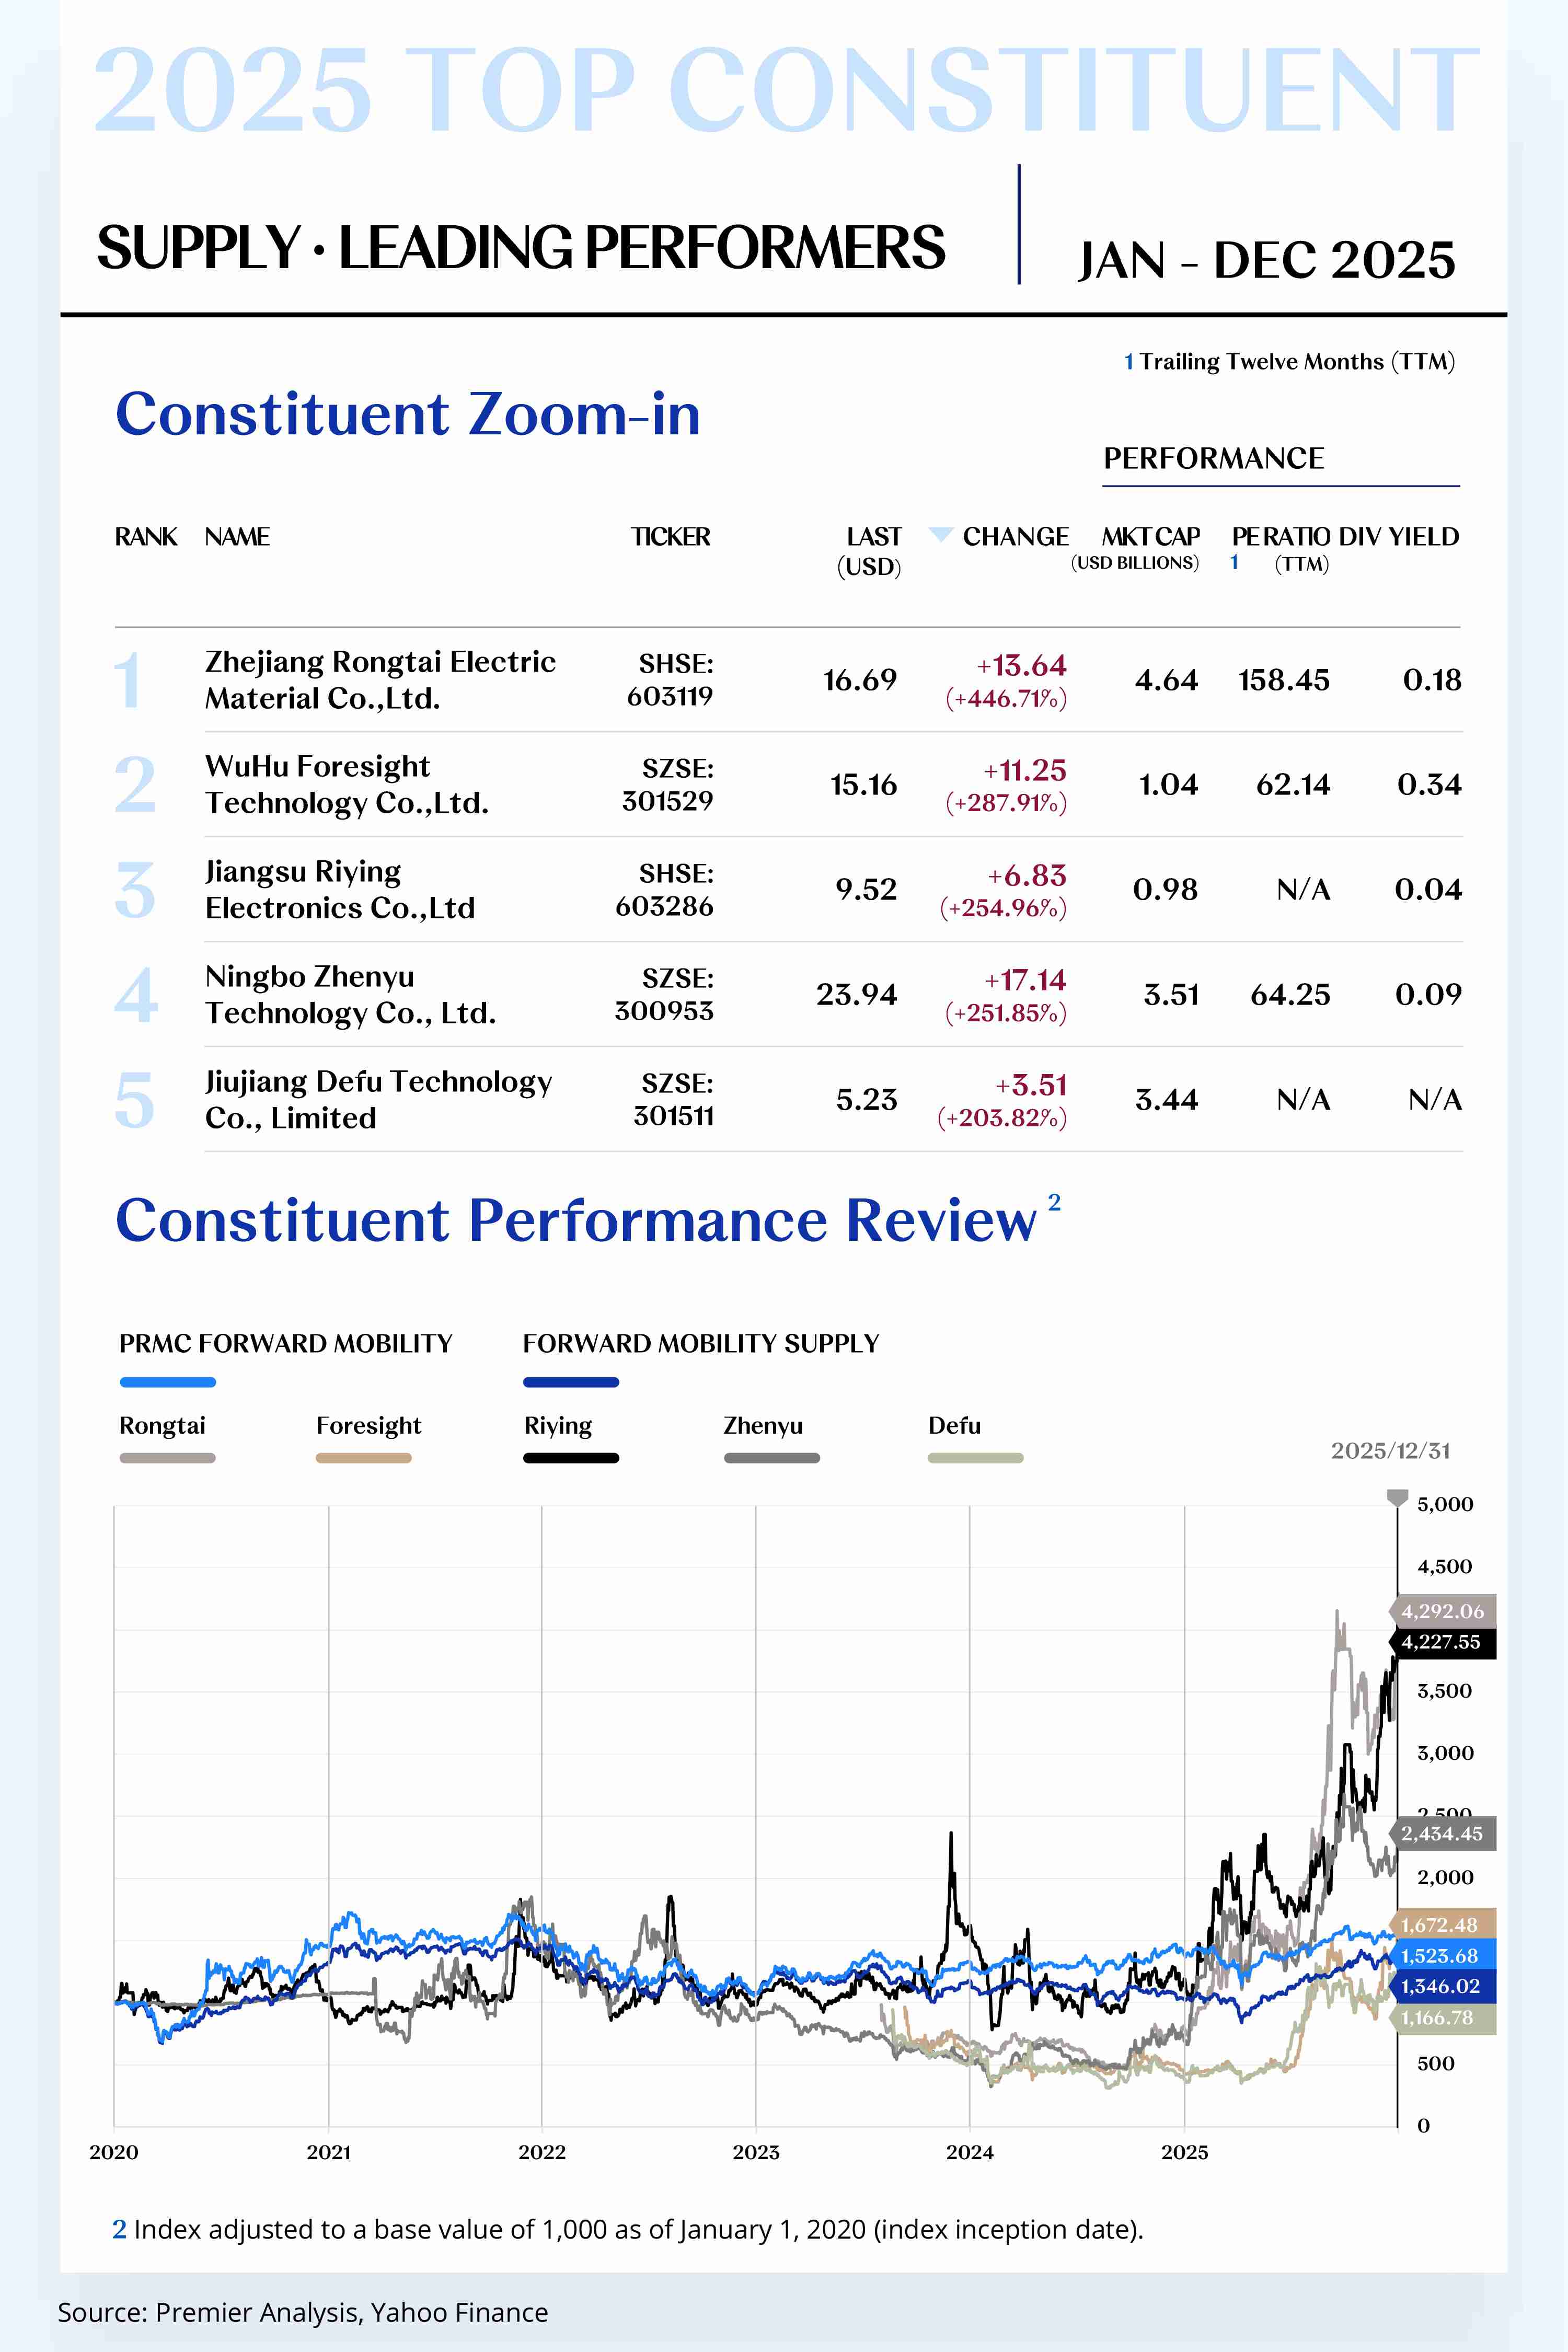
Zhejiang Rongtai is a leading domestic supplier of insulation and composite materials. Its core products include mica-based composite materials and thermal protection components for new‑energy batteries, widely used in NEVs, stationary energy storage systems, and high‑temperature specialty equipment. For full‑year 2025, the company’s share price rose by $13.64 to close at $16.69, a 446.71% gain for the year.
On February 28, 2025, the board of directors and the supervisory committee approved deploying up to RMB 520 million of idle IPO proceeds for cash management, reflecting a prudent balance between liquidity and yield.
On October 30, the company released its Q3 report: RMB 960 million in revenue, RMB 203 million in net profit attributable to shareholders, and RMB 173 million in net operating cash flow. It also disclosed progress in its new robotics business and preparatory work for its Thailand base, anchoring a “smart transmission + robotics” second growth curve and a forward‑deployed overseas capacity layout.
On December 26, it signed a JV intent letter with Suzhou INVT Electric Technology to co‑build in Thailand an integrated mechatronics components and smart transmission systems joint venture, enhancing global supply‑chain resilience and product‑line synergies.
On December 30, the board approved proposals on H‑share issuance and Articles amendments after an overseas listing and on board governance adjustments, laying governance and compliance groundwork for a planned Hong Kong H‑share listing to broaden overseas capital access and bolster the basis for valuation and liquidity.
Outlook for 2026: Zhejiang Rongtai is poised to sustain growth across multiple dimensions—capacity ramp‑up, order onboarding, capital‑market channel optimization, and product‑matrix extension. Output planning for robotics precision transmission parts (including micro ball screws) targets an increase from roughly 1,000 sets/week at present to 5,000–10,000 sets/week. As yields improve and scale effects kick in, unit costs should decline with margin mix improving. Overseas factory ramp‑ups will accelerate, with Thailand and Mexico facilities expected to start production in the first half and complete order onboarding and certification for global robotics and NEV customers, likely lifting overseas revenue mix and improving cash‑flow quality.
[For more insights, please download the full report]
Quality Compounders
1. Ningbo Tuopu Group Co., Ltd. (SHSE: 601689)
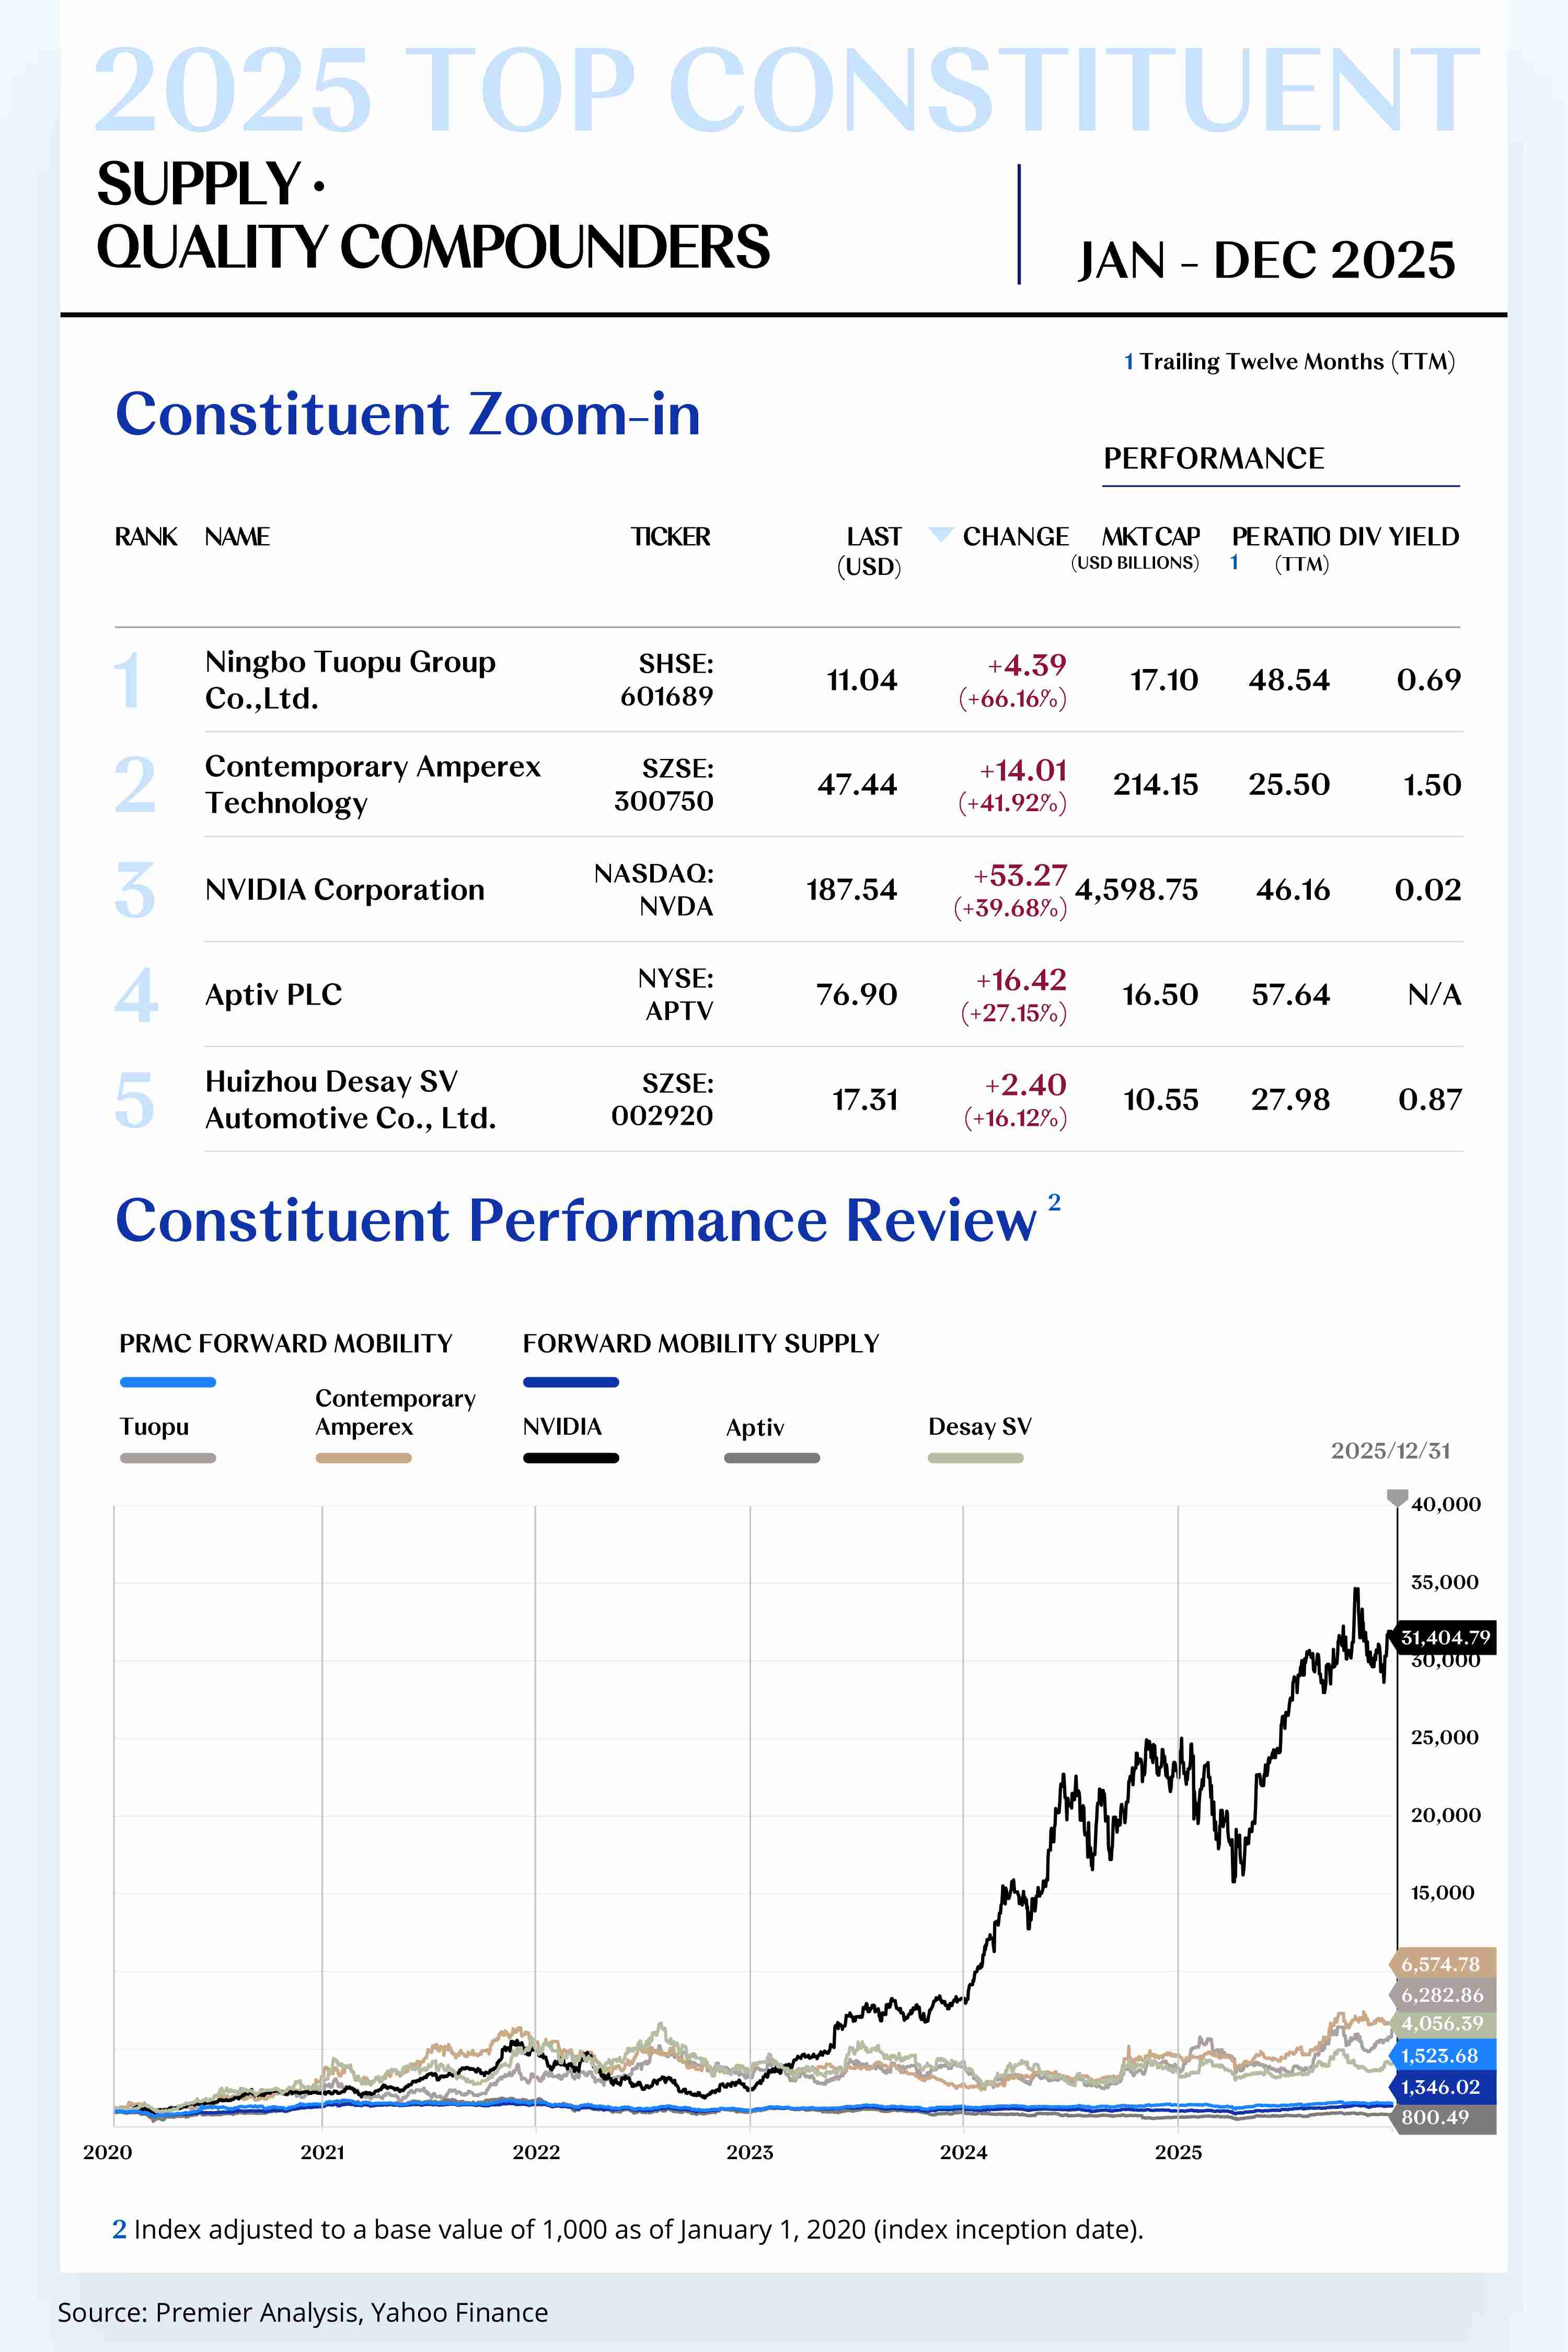
Tuopu focuses on power‑chassis systems, interior & exterior systems, and intelligent driving control systems, offering end‑to‑end capabilities from materials R&D and product design to system integration. For full‑year 2025, its share price rose by $4.39 to close at $11.04, up 66.16%.
On May 14, Tuopu completed the acquisition of Wuhu Changpeng Auto Parts, integrating product lines and customer resources to optimize business structure and customer mix, deepening penetration in OEM systems.
On August 28, its H1 report disclosed that the Mexico project was advancing Phase‑II construction per the guarantee announcement in April, with overseas capacity ramping in a controlled cadence.
Review: Technology innovation, capacity extension, and bolt‑on M&A worked in concert to reinforce its global competitiveness and order‑winning capability in NEV components, with earnings resilience and international operations set to keep strengthening.
Outlook for 2026: With global NEV demand expanding and platformization progressing, overseas revenue share is expected to rise notably as Europe & North America new capacity enters full ramp, augmenting cross‑regional supply and delivery capability. The company will keep upgrading to higher value‑add, with smart chassis, lightweight components, and e‑drive assemblies as core growth engines—lifting order quality and ASPs.
2. Contemporary Amperex Technology Co., Limited (SZSE: 300750)
CATL is a global leader in lithium‑ion batteries for NEVs and energy storage. For full‑year 2025, its share price rose by $14.01 to close at $47.44, up 41.92%.
In 2025, CATL accelerated capital operations and technology innovation in parallel. On January 23, it paid a cash dividend of RMB 1.23/share and pressed ahead with an H‑share listing plan.
On April 21, at Shanghai Super Tech Day, it launched three core technologies—the Freevoy Dual‑Core Battery, Shenxing Gen‑2 Ultra‑Fast‑Charging Battery, and Naxtra sodium‑ion battery—cementing leadership in high‑performance traction batteries, extreme‑climate adaptability, and multi‑route innovation.
On May 20, CATL debuted on the HKEX Main Board, globally offering 135 million H‑shares at HK$263; opening at HK$296, it became one of 2025’s most influential IPOs, broadening overseas financing and the international investor base.
On October 20, the Q3 report showed RMB 104.2 billion in revenue and RMB 18.55 billion in net profit to shareholders (+41% YoY), with new‑product mix upgrades and share gains amplifying profit elasticity.
In energy services, the company accelerated its battery‑swap network. By December, Choco swap stations reached 1,020 for passenger cars and 305 for heavy trucks, with the 2026 station target raised to 3,000, creating strong synergy between swap infrastructure and batteries, supporting global operations and earnings resilience.
Outlook for 2026: CATL is set to consolidate absolute leadership as global NEV and storage demand grows. Global capacity is entering a TWh‑scale ramp; the Hungary cell plant starts up early in the year and ramps together with Germany, lifting overseas delivery and revenue mix while solidifying international layout.
[For more insights, please download the full report]
Growth Accelerators
1. Feilong Auto Components Co., Ltd. (SZSE: 002536)
Feilong specializes in the R&D, manufacturing, and sales of auto components, chiefly engine cooling and intake/exhaust systems for passenger and commercial vehicles. For full‑year 2025, its share price rose by $2.99 to $4.54, up 192.41%.
In 2025, it advanced NEV thermal‑management order wins, supply‑chain collaboration, and new application scenarios.
On March 26, it announced a fixed award for an electric oil pump project from a renowned global Tier‑1, with RMB 160 million lifecycle revenue—an important order base for its NEV thermal‑management products.
On July 23, H1 2025: revenue −8.67% YoY, but net profit +14.49% YoY—showing profit resilience amid intensified competition and product‑mix adjustments.
Outlook for 2026: Centered on “thermal management + lightweighting,” Feilong seeks steady expansion as NEV and hybrid penetration rises. Growing demand for e‑drive cooling, heat‑pump HVAC, and battery thermal control should lift NEV revenue mix. Smart‑manufacturing upgrades in Hubei are ramping; automation and digitalization are being implemented. As awarded projects from major OEMs enter mass production, unit manufacturing costs should decline, delivery efficiency improve, and margin structure further optimize.
2. Amprius Technologies, Inc. (NYSE: AMPX)
Amprius is a high‑energy‑density lithium‑battery manufacturer built on silicon‑anode technology, serving aerospace, UAS, and high‑performance EV fields. For full‑year 2025, its share price rose by $5.03 to $7.83, up 179.64%.
On August 8, Q2 2025 results confirmed revenue growth while gross margin remained negative; within 2025 the company broadened its portfolio to the SiCore™ platform, extending silicon‑anode coverage.
Dec 4–12: It presented at the Janney Clean Energy Conference, AABC Las Vegas, and Northland Growth Conference, showcasing next‑gen silicon‑anode roadmaps and capacity plans.
Outlook for 2026: With rising demand for high‑energy batteries in aerospace, UAS, and high‑performance EVs, scale applications of silicon‑anode cells should accelerate. As the Colorado plant reaches nameplate outputs and overseas contract‑manufacturing deepens, total capacity is expected to double YoY, significantly lifting revenue scale.
[For more insights, please download the full report]
FM MANUFACTURING CONSTITUENT ZOOM-IN
Robust Product Delivery Solidifying
Market Confidence;
Collaborations and Acquisitions Strengthening
Value Chain Integration
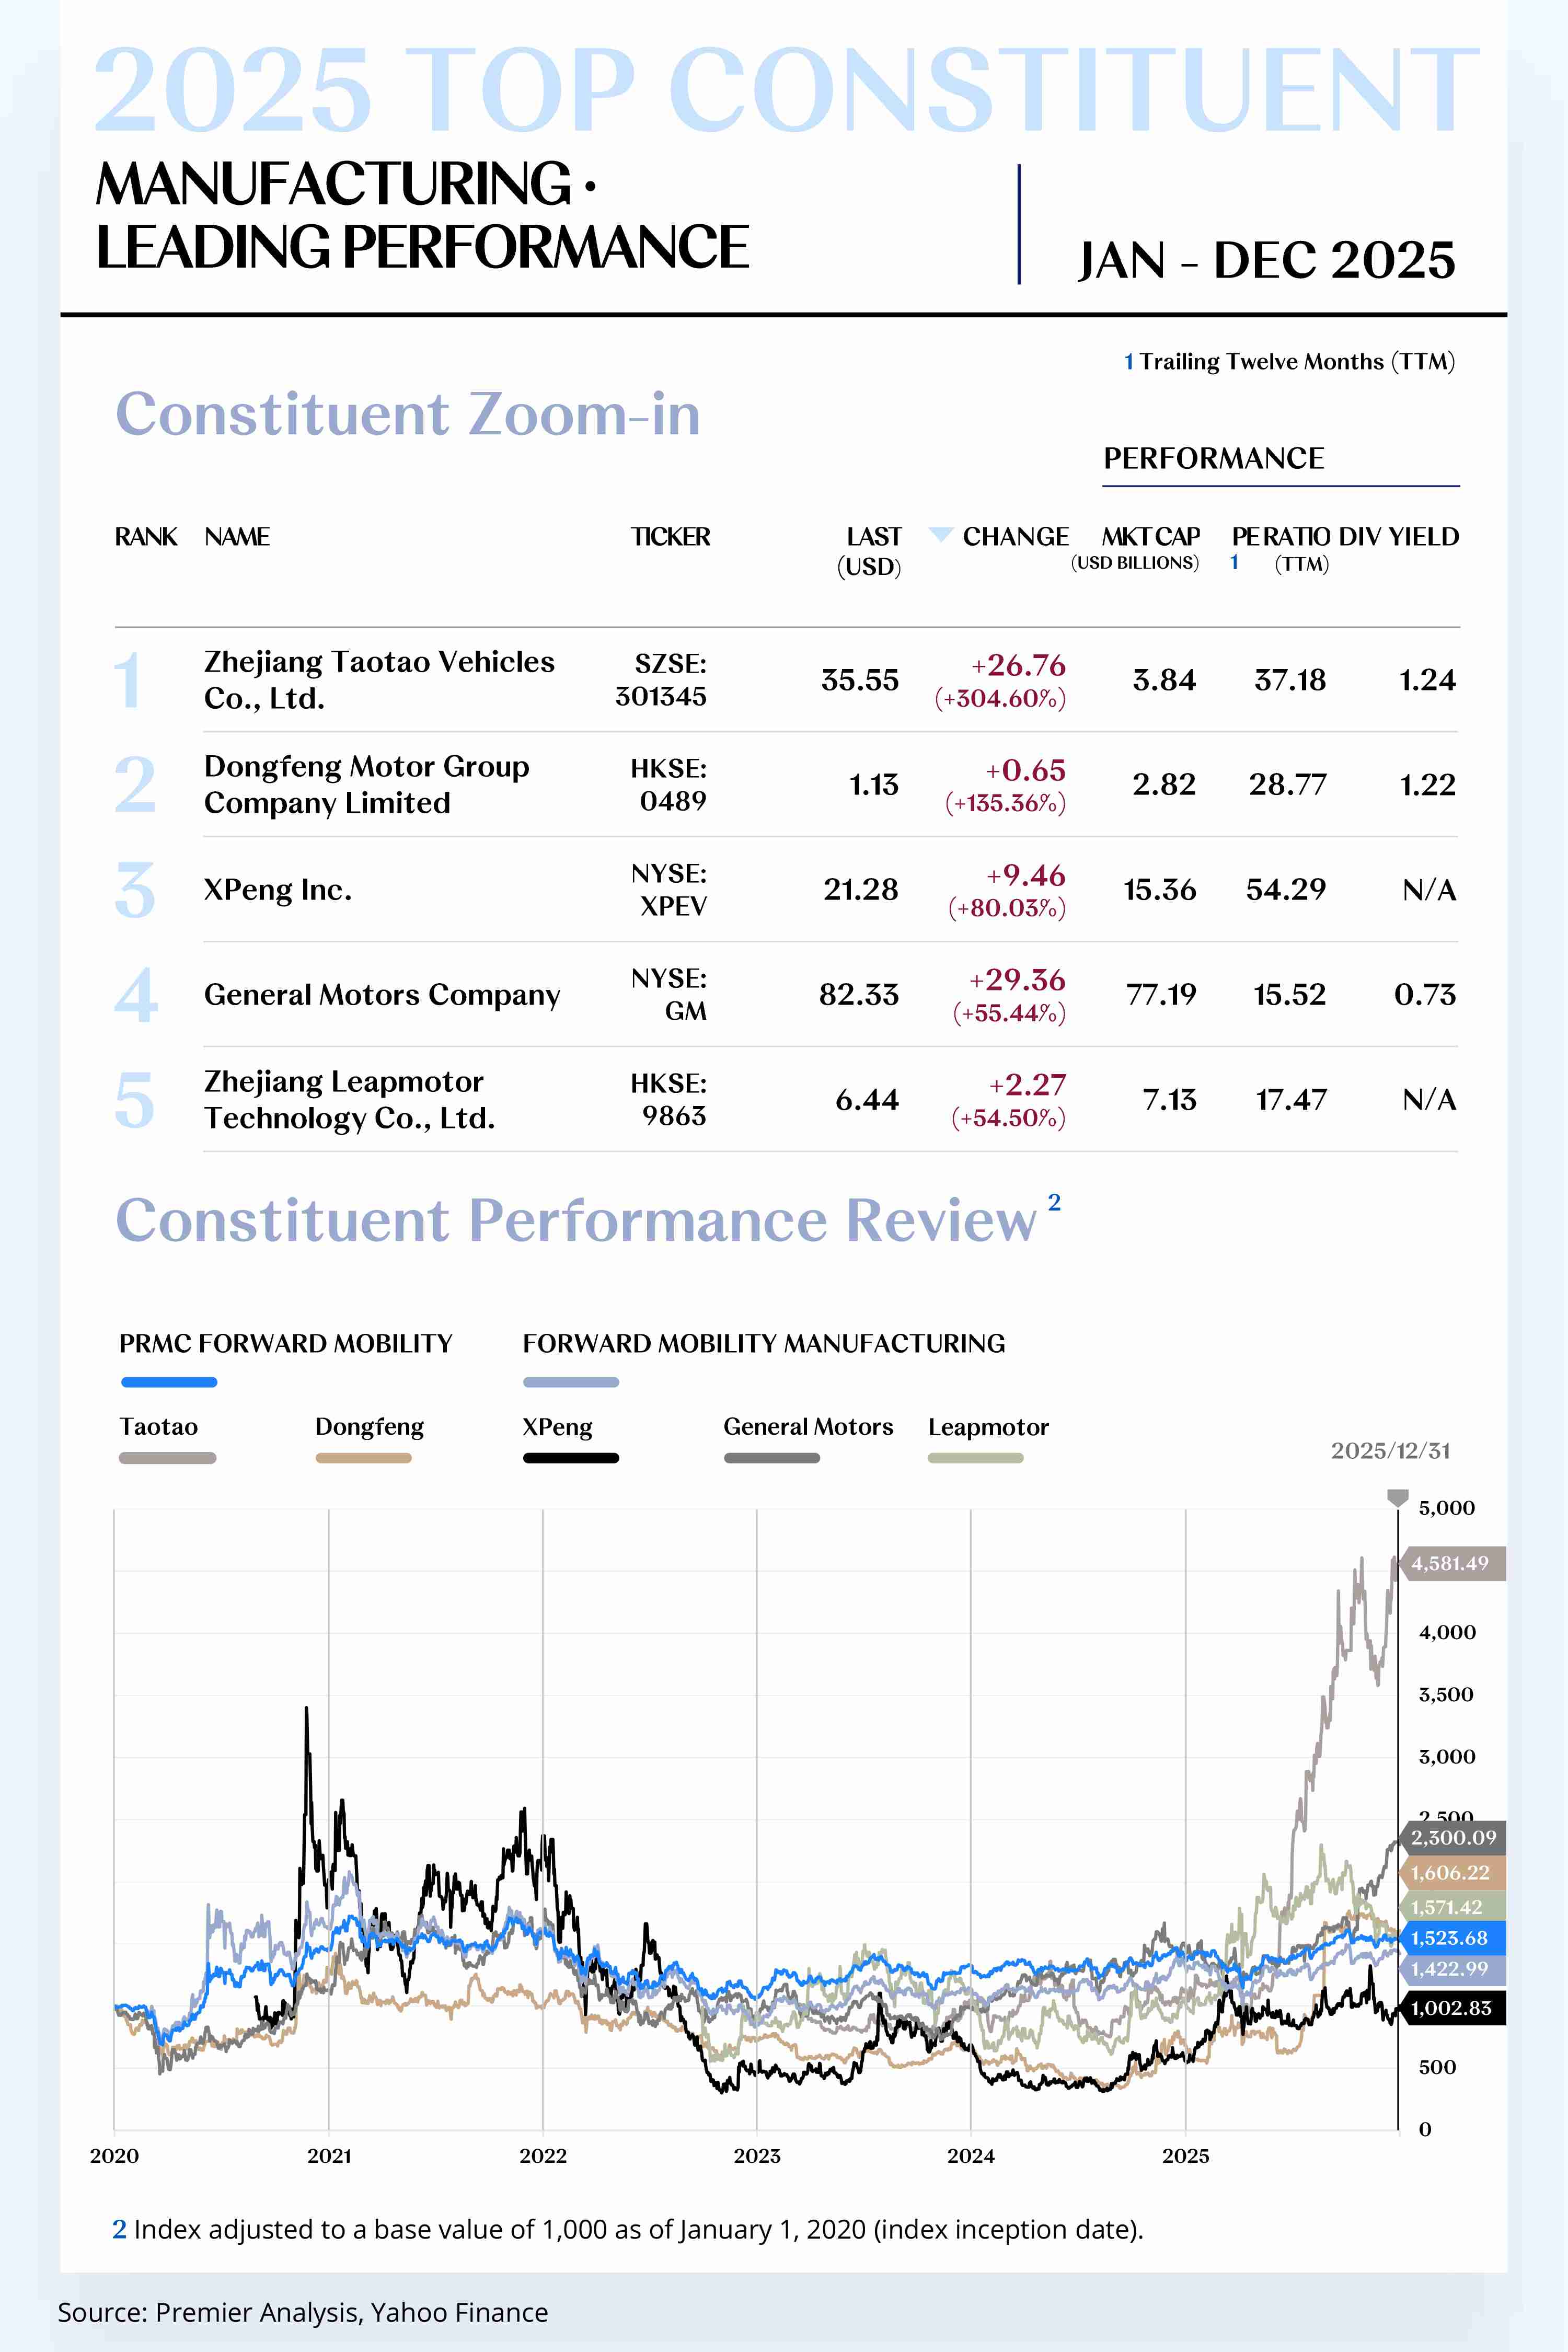
The Forward Mobility Manufacturing Index comprises 79 stocks, with 52 rising and 27 declining.
Leading Performers
1. Zhejiang Taotao Vehicles Co., Ltd. (SZSE: 301345)
Taotao Vehicle Industry focuses on the R&D, production, and sales of intelligent short-distance mobility and outdoor recreational products such as all-terrain vehicles (ATVs) and electric scooters. For full year 2025, the company’s share price rose by US$26.76 to close at US$35.55, representing an annual increase of 304.60%.
In 2025, the company continued to advance operations and layout around three main themes: “capital structure optimization, global expansion, and channel integration.”
From August 25 to August 26, the company released its 2025 interim results, reporting revenue of RMB 1.713 billion and net profit attributable to the parent of RMB 342 million, with revenue up 23.19% year over year and net profit attributable to the parent up 88.04%. It also proposed integrating a global manufacturing system with robotics to enhance long-term efficiency and scaling capability.
On November 3, the company submitted an application to the Hong Kong Stock Exchange for the issuance and listing of H-shares, marking the official launch of its international capital market strategy to broaden overseas financing channels and increase global investor coverage.
On December 19, through its subsidiary ThunderTrek Inc., the company completed a US$15 million acquisition of Champion Motorsports, further strengthening its channel network and brand reach in the North American market.
Looking ahead to 2026, Taotao Vehicle Industry is expected to maintain rapid growth driven by both internationalization and product mix upgrades. As the H-share listing process progresses, the company’s international financing capability and global brand visibility are expected to further improve, accelerating its expansion of electric recreational vehicles and powertrain businesses in the North American and European markets.
[For more insights, please download the full report]
Quality Compounders
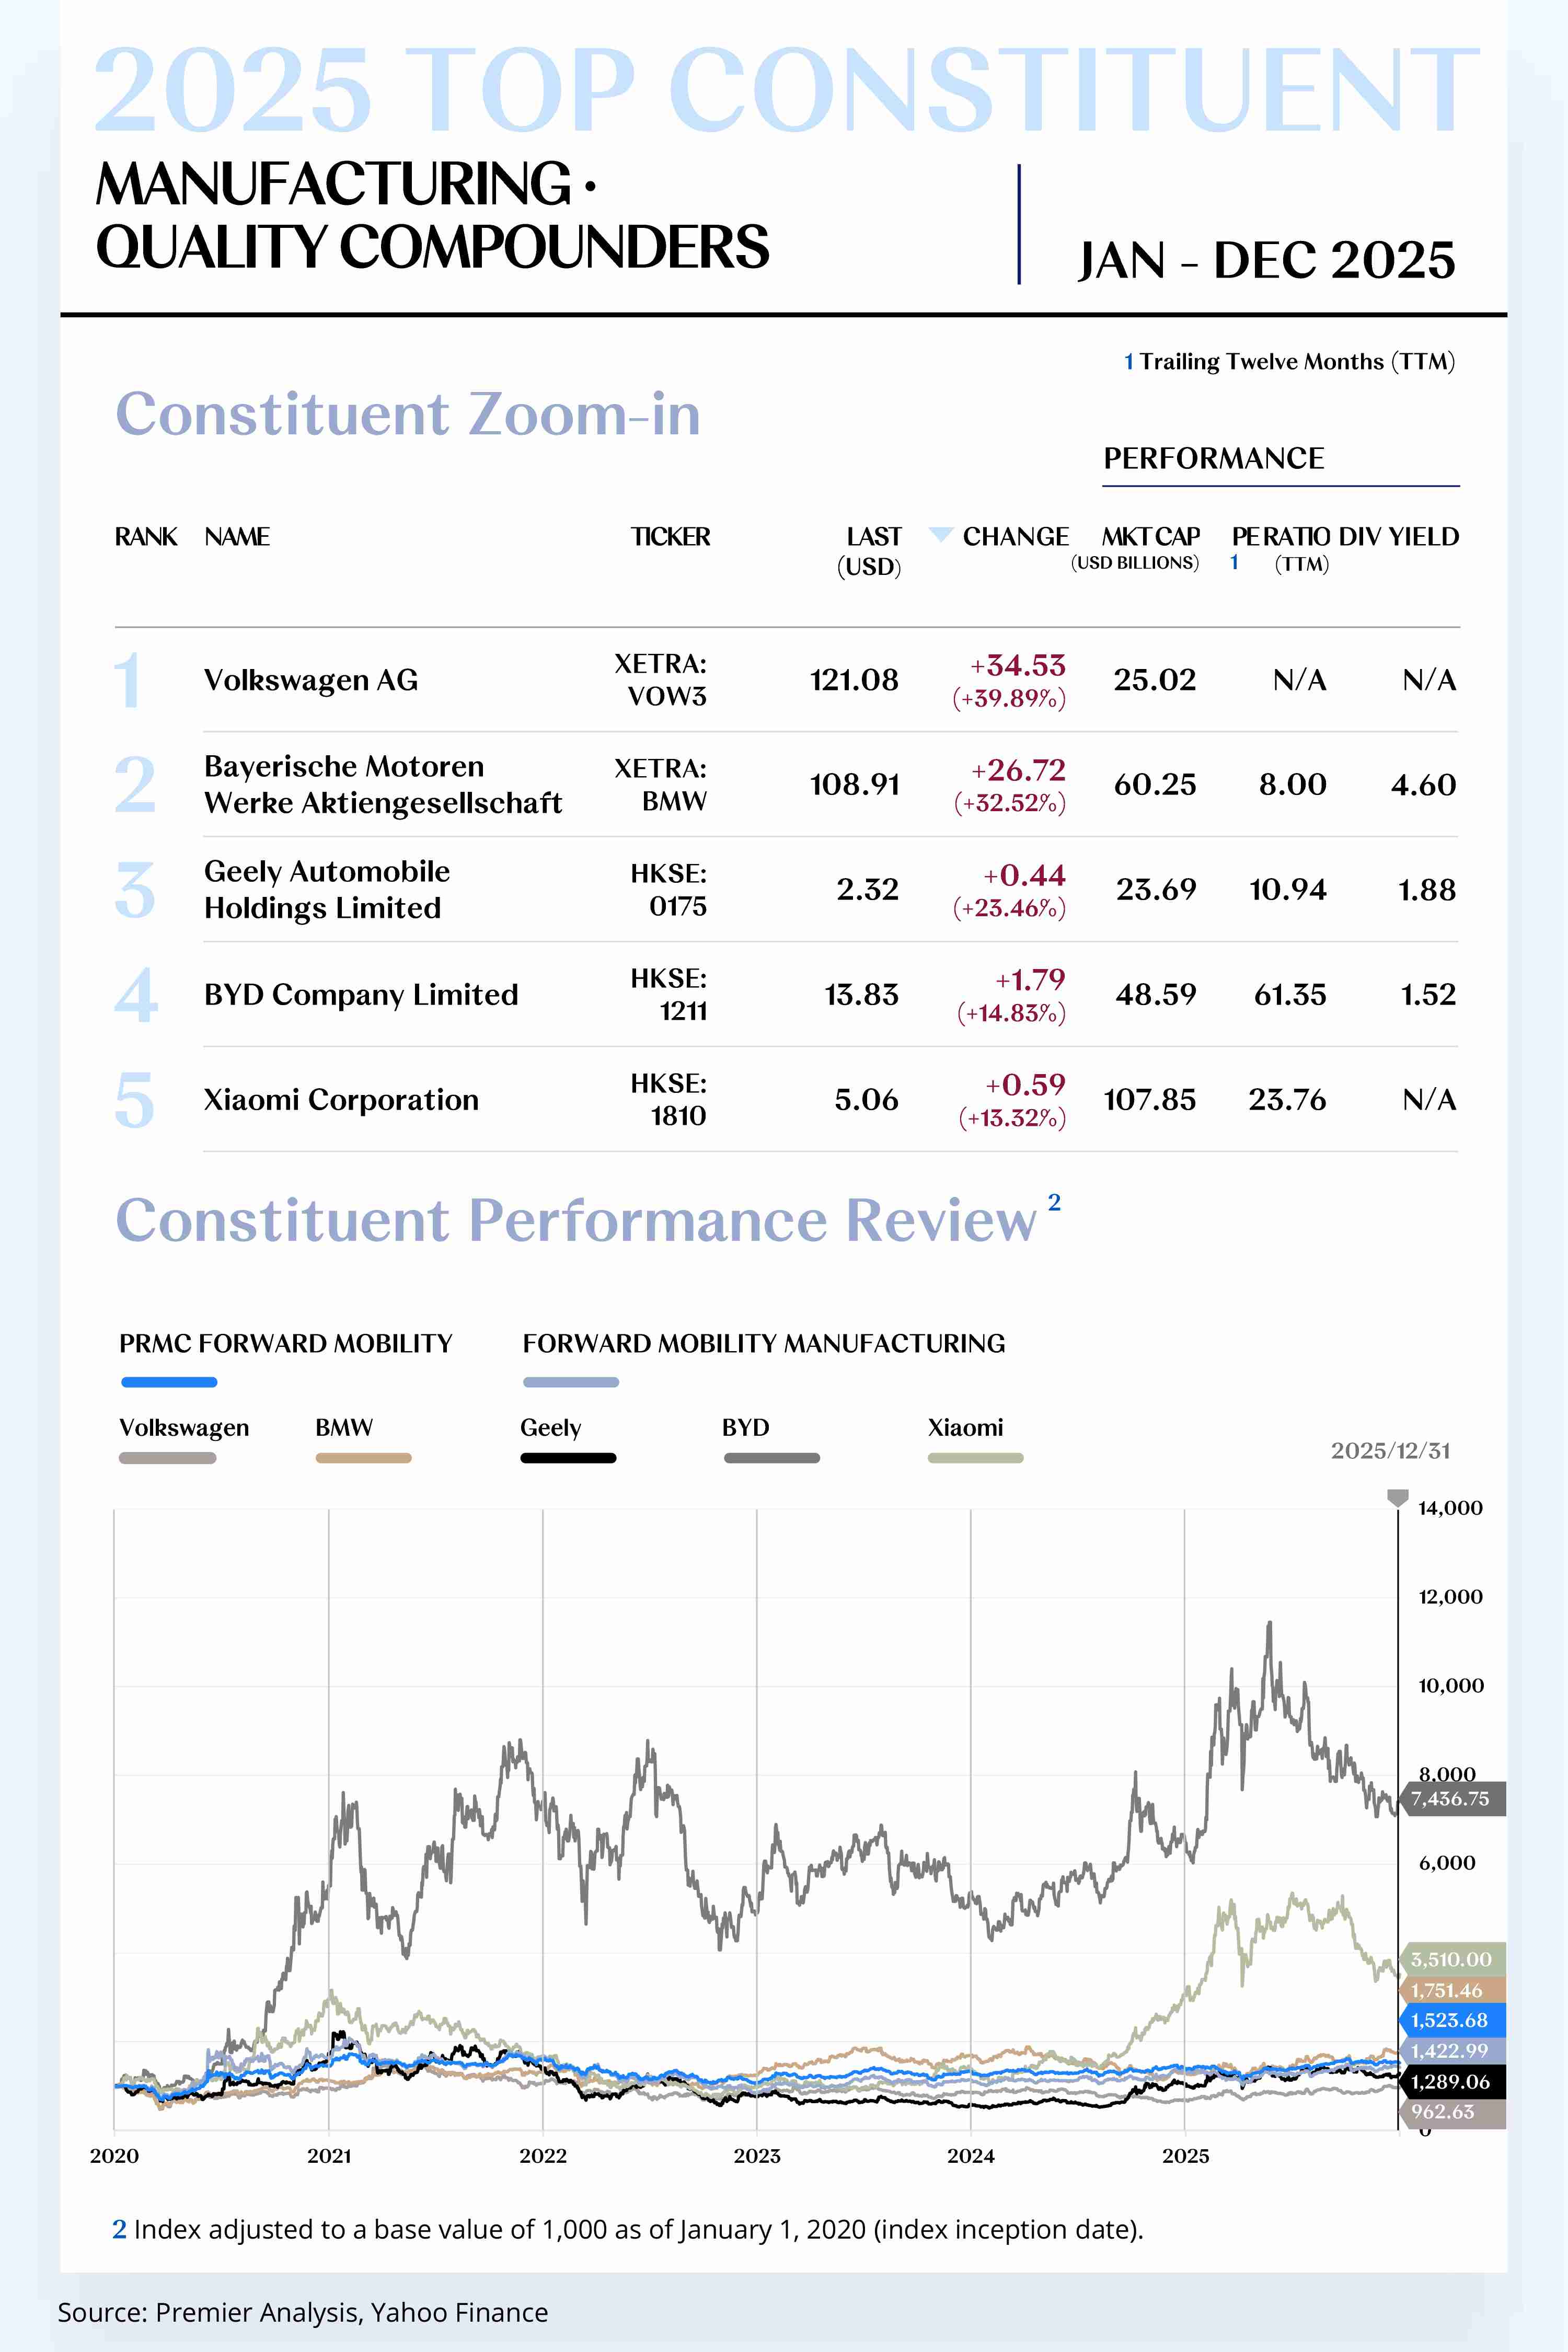
1. Volkswagen Group (XETRA: VOW3)
Volkswagen Group is a global leading automaker with multiple renowned brands, including Volkswagen, Audi, and Porsche, covering a wide range of segments from mass-market passenger cars to premium luxury vehicles, motorcycles, and light- and heavy-duty commercial vehicles. For full year 2025, the company’s share price rose by US$34.53 to close at US$121.08, an annual increase of 39.89%.
In 2025, Volkswagen advanced operations and transformation along four themes: “electrification, software-defined vehicles, localized China strategy, and battery supply chain restructuring.”
In China-market intelligent EV cooperation, the Group signed a master agreement with XPENG in 2024 to co-develop the first two Volkswagen-branded mid-sized intelligent BEV models, planned for launch in 2026. In August 2025, the Group further announced that the China Electrical/Electronic Architecture (CEA) would be extended to ICE and PHEV models in China; in December, the Group disclosed that the ID.Unyx 07 based on CEA had entered production preparation at Volkswagen Anhui, signaling that the joint development project is moving into industrialization.
In batteries and technology roadmap, in December the Group’s PowerCo officially launched unified cell mass production at the Salzgitter plant in Germany and began supplying samples for testing to Group brands. This plant will act as the “mother plant” for subsequent battery plants in Spain and Canada. Meanwhile, the Group continued to deepen joint development and industrialization of solid-state batteries with QuantumScape and accelerated construction of the QSE-5 solid-state pilot line through additional funding.
Looking ahead to 2026, Volkswagen is expected to further optimize its operating structure, driven by electrification, software platforms, and the localized rollout of products in China.
On the battery and supply chain side, PowerCo achieved unified cell mass production in Salzgitter in 2025 and began supplying to vehicle programs, and is expected to start serving the “Electric Urban Car” series in 2026; at the same time, QuantumScape’s solid-state batteries remain in validation and pilot phases, with mass-production timelines dependent on technological milestones and cost curve progress.
2. BMW Group (XETRA: BMW)
BMW Group is a global leader in premium automobiles, with brands including BMW, MINI, and Rolls-Royce. For full year 2025, the company’s share price rose by US$26.72 to close at US$108.91, an annual increase of 32.52%.
In 2025, BMW advanced its transformation along four themes: the Neue Klasse EV platform, software-defined vehicles, next-generation battery technologies, and localized intelligence in China.
On March 14, the Group released its 2024 annual report, achieving profit before tax of €10.971 billion and an automotive EBIT margin of 6.3%, with net profit of €7.68 billion, down 36.9% year over year. Management confirmed a 2025 automotive EBIT margin target range of 5%–7% and, amid a more challenging tariff environment and competition in China, continued to push for the industrialization of the Neue Klasse platform.
In batteries and technology cooperation, the Group continued the long-term cylindrical cell supply framework signed with CATL in 2022, with CATL supplying 46-series cylindrical cells for Neue Klasse models from 2025, and planned single-side capacity of up to 20 GWh each in Europe and China. In May 2025, the Group and Solid Power installed large-format all-solid-state battery (ASSB) samples in the BMW i7 for road testing to validate engineering feasibility and industrialization pathways for next-generation battery technology.
In long-term strategy, the Group reiterated that by 2030 pure EVs will account for about 50% of global sales, and, through multi-site manufacturing in Debrecen, Munich, and Mexico as well as the “In China, for China” strategy, it will accelerate the global mass-production pace and regional adaptation of the Neue Klasse.
Looking ahead to 2026, BMW is expected to further optimize its operating structure through full-scale ramp-up of the Neue Klasse platform, expansion of the EV lineup, and enhanced monetization of the software platform.
In software and intelligence, BMW Operating System X and Panoramic iDrive will be introduced with the mass production of Neue Klasse models from late 2025, and in 2026 are expected to achieve broader OTA iteration and cross-model software stack reuse; coupled with localized ADAS cooperation with Momenta in China, the commercialization coverage of advanced driver assistance and digital services is expected to increase, improving per-vehicle recurring revenue.
[For more insights, please download the full report]
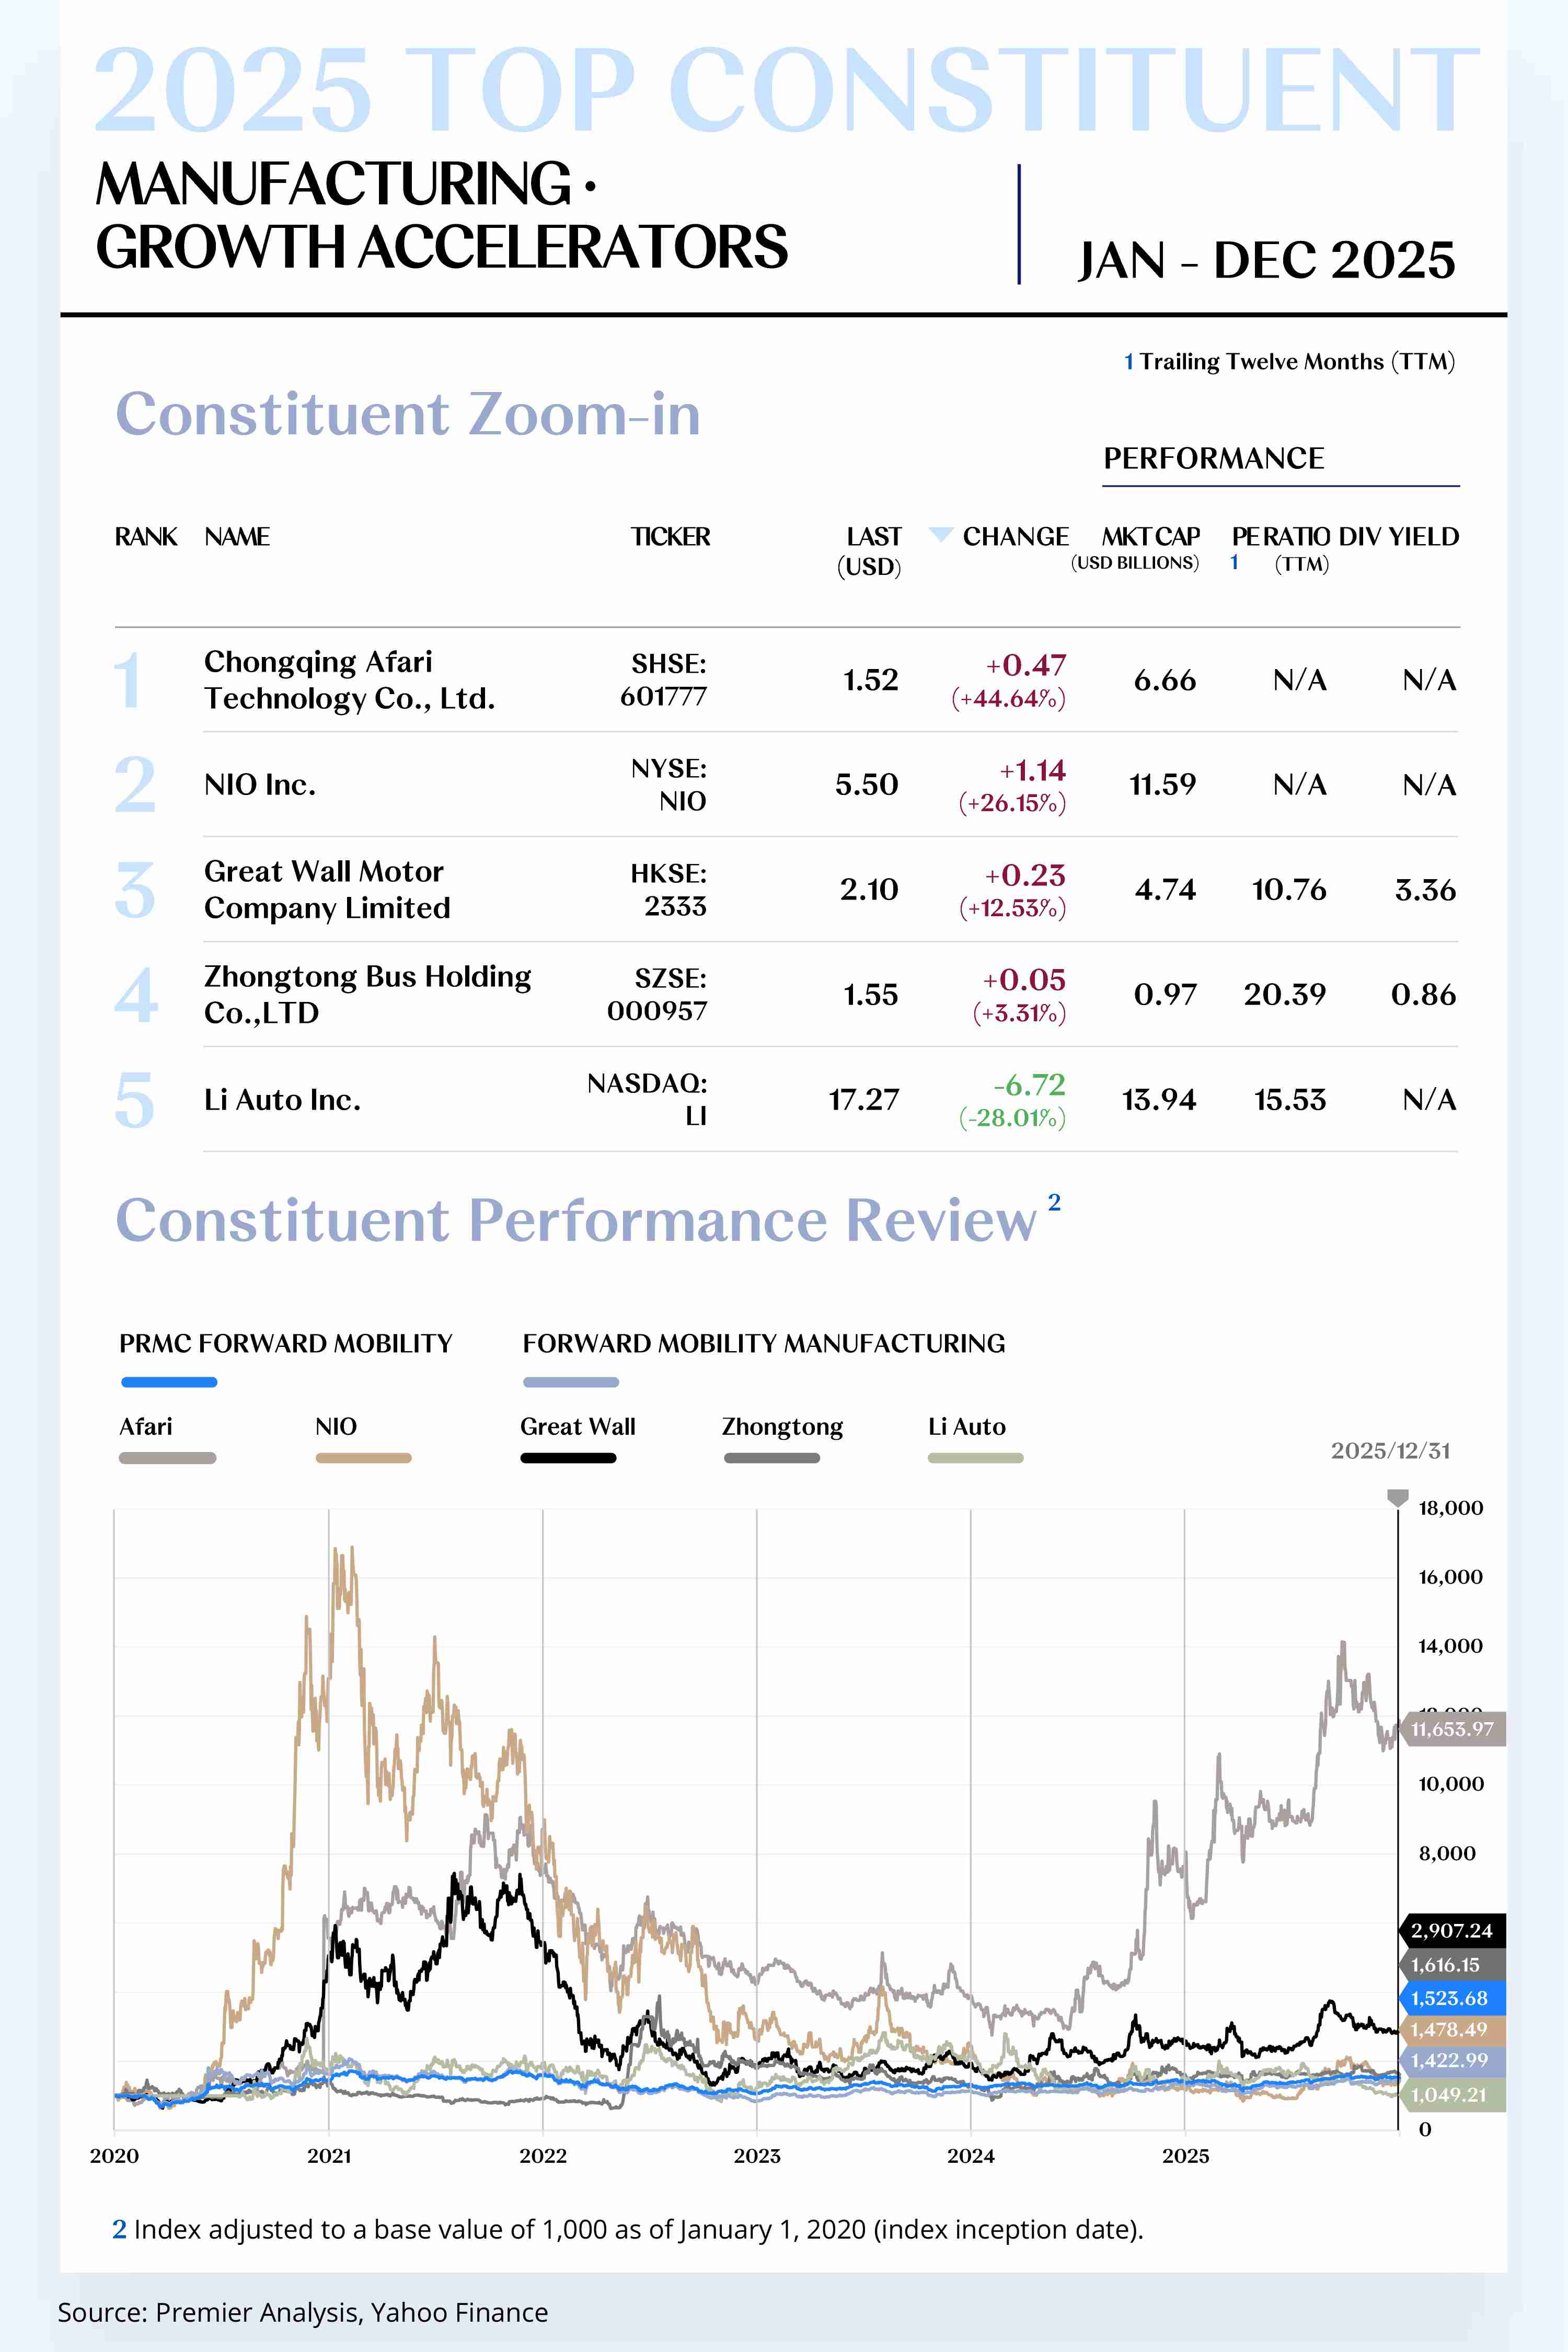
Growth Accelerators
1. Qianli Technology (SHSE: 601777)
Qianli Technology is a comprehensive manufacturing enterprise with businesses spanning passenger vehicles, new energy vehicles, and motorcycles. For full year 2025, the company’s share price rose by US$0.47 to close at US$1.52, an annual increase of 44.64%.
On February 12, 2025, the company completed industrial and commercial registration to officially change its name from “Lifan Technology (Group) Co., Ltd.” to “Chongqing Qianli Technology Co., Ltd.” and, starting February 18, changed its stock short name to “Qianli Technology.”
On February 21, the company launched a comprehensive intelligent R&D cooperation with Geely Automobile and Jieyue Xingchen, jointly developing intelligent driving and intelligent cockpit to solidify its technical reserves in in-vehicle computing platforms, algorithms, and software systems.
On September 12, the company’s board approved proposals related to the issuance of H-shares and listing on the Hong Kong Stock Exchange; on September 13, it issued a cautionary announcement stating it would seize favorable opportunities to advance its overseas capital market layout, expanding financing channels and enhancing international influence.
On December 3, the company’s subsidiary Qianli Intelligent Driving signed a strategic cooperation agreement with Caocao Mobility to carry out commercialization in the Robotaxi scenario, accelerating the application of autonomous driving technology.
On December 24, Mercedes-Benz formally acquired a 3% equity stake in Qianli Technology, becoming the company’s fifth-largest shareholder and significantly enhancing its position in global automaker ecosystems and the scope for future cooperation.
Looking ahead to 2026, Qianli Technology will pursue steady growth around two main lines: “new energy core components” and “intelligent manufacturing upgrades.”
In manufacturing, intelligent plants in Chongqing and other locations will, as lines ramp and automation/digital transformation continues to land, significantly improve unit output efficiency and drive manufacturing costs downward, thereby improving gross margin structure and delivery capacity.
In markets and customers, the company will deepen collaboration with leading OEMs and Tier-1 suppliers while accelerating expansion into overseas growth markets such as Southeast Asia and Europe, forming a multi-polar growth curve across domestic and international markets.
2. NIO Inc. (NYSE: NIO)
NIO is a leading company in China’s intelligent EV market, focused on delivering high-performance intelligent electric vehicles and a comprehensive user experience. For full year 2025, the company’s share price rose by US$1.14 to close at US$5.50, an annual increase of 26.15%.
In 2025, NIO entered a critical realization phase of “intensive product releases + technology platform delivery + three-brand synergy.”
On April 29, the first model under the Firefly brand began user deliveries in multiple cities, officially forming a three-tier brand structure covering high-end (NIO), mainstream family (ONVO), and entry-level (Firefly).
On June 3, the company released 2025 first-quarter financial results: quarterly deliveries of 42,094 units, revenue of RMB 12.035 billion, a vehicle gross margin of 10.2%, and second-quarter delivery guidance of 72,000–75,000 units, highlighting a significant acceleration in production and sales rhythm.
Looking ahead to 2026, NIO will enter a stage of overlapping drivers: “product dividend realization + technological cost reduction and efficiency improvement + international channel expansion.”
In products and technology, the third-generation ES8 and ET9 achieved mass-production launch in 2025; coupled with continuous refreshes of core models such as ET5/ET5T and ES6/EC6, and the scaled introduction of the self-developed “Shenji NX9031” chip, SkyOS full-domain operating system, and intelligent chassis—the “new three major systems”—NIO is expected to continue reducing hardware and system costs without sacrificing user experience, driving further improvement in vehicle gross margin.
[For more insights, please download the full report]

AUTO SERVICE CONSTITUENT ZOOM-IN
Diversified Service Expansion
Meeting Market Demands;
Strategic Partnership Deployment
Accelerating Channel Penetration
The Forward Mobility Service Index comprises 37 stocks, with 16 rising and 21 declining.
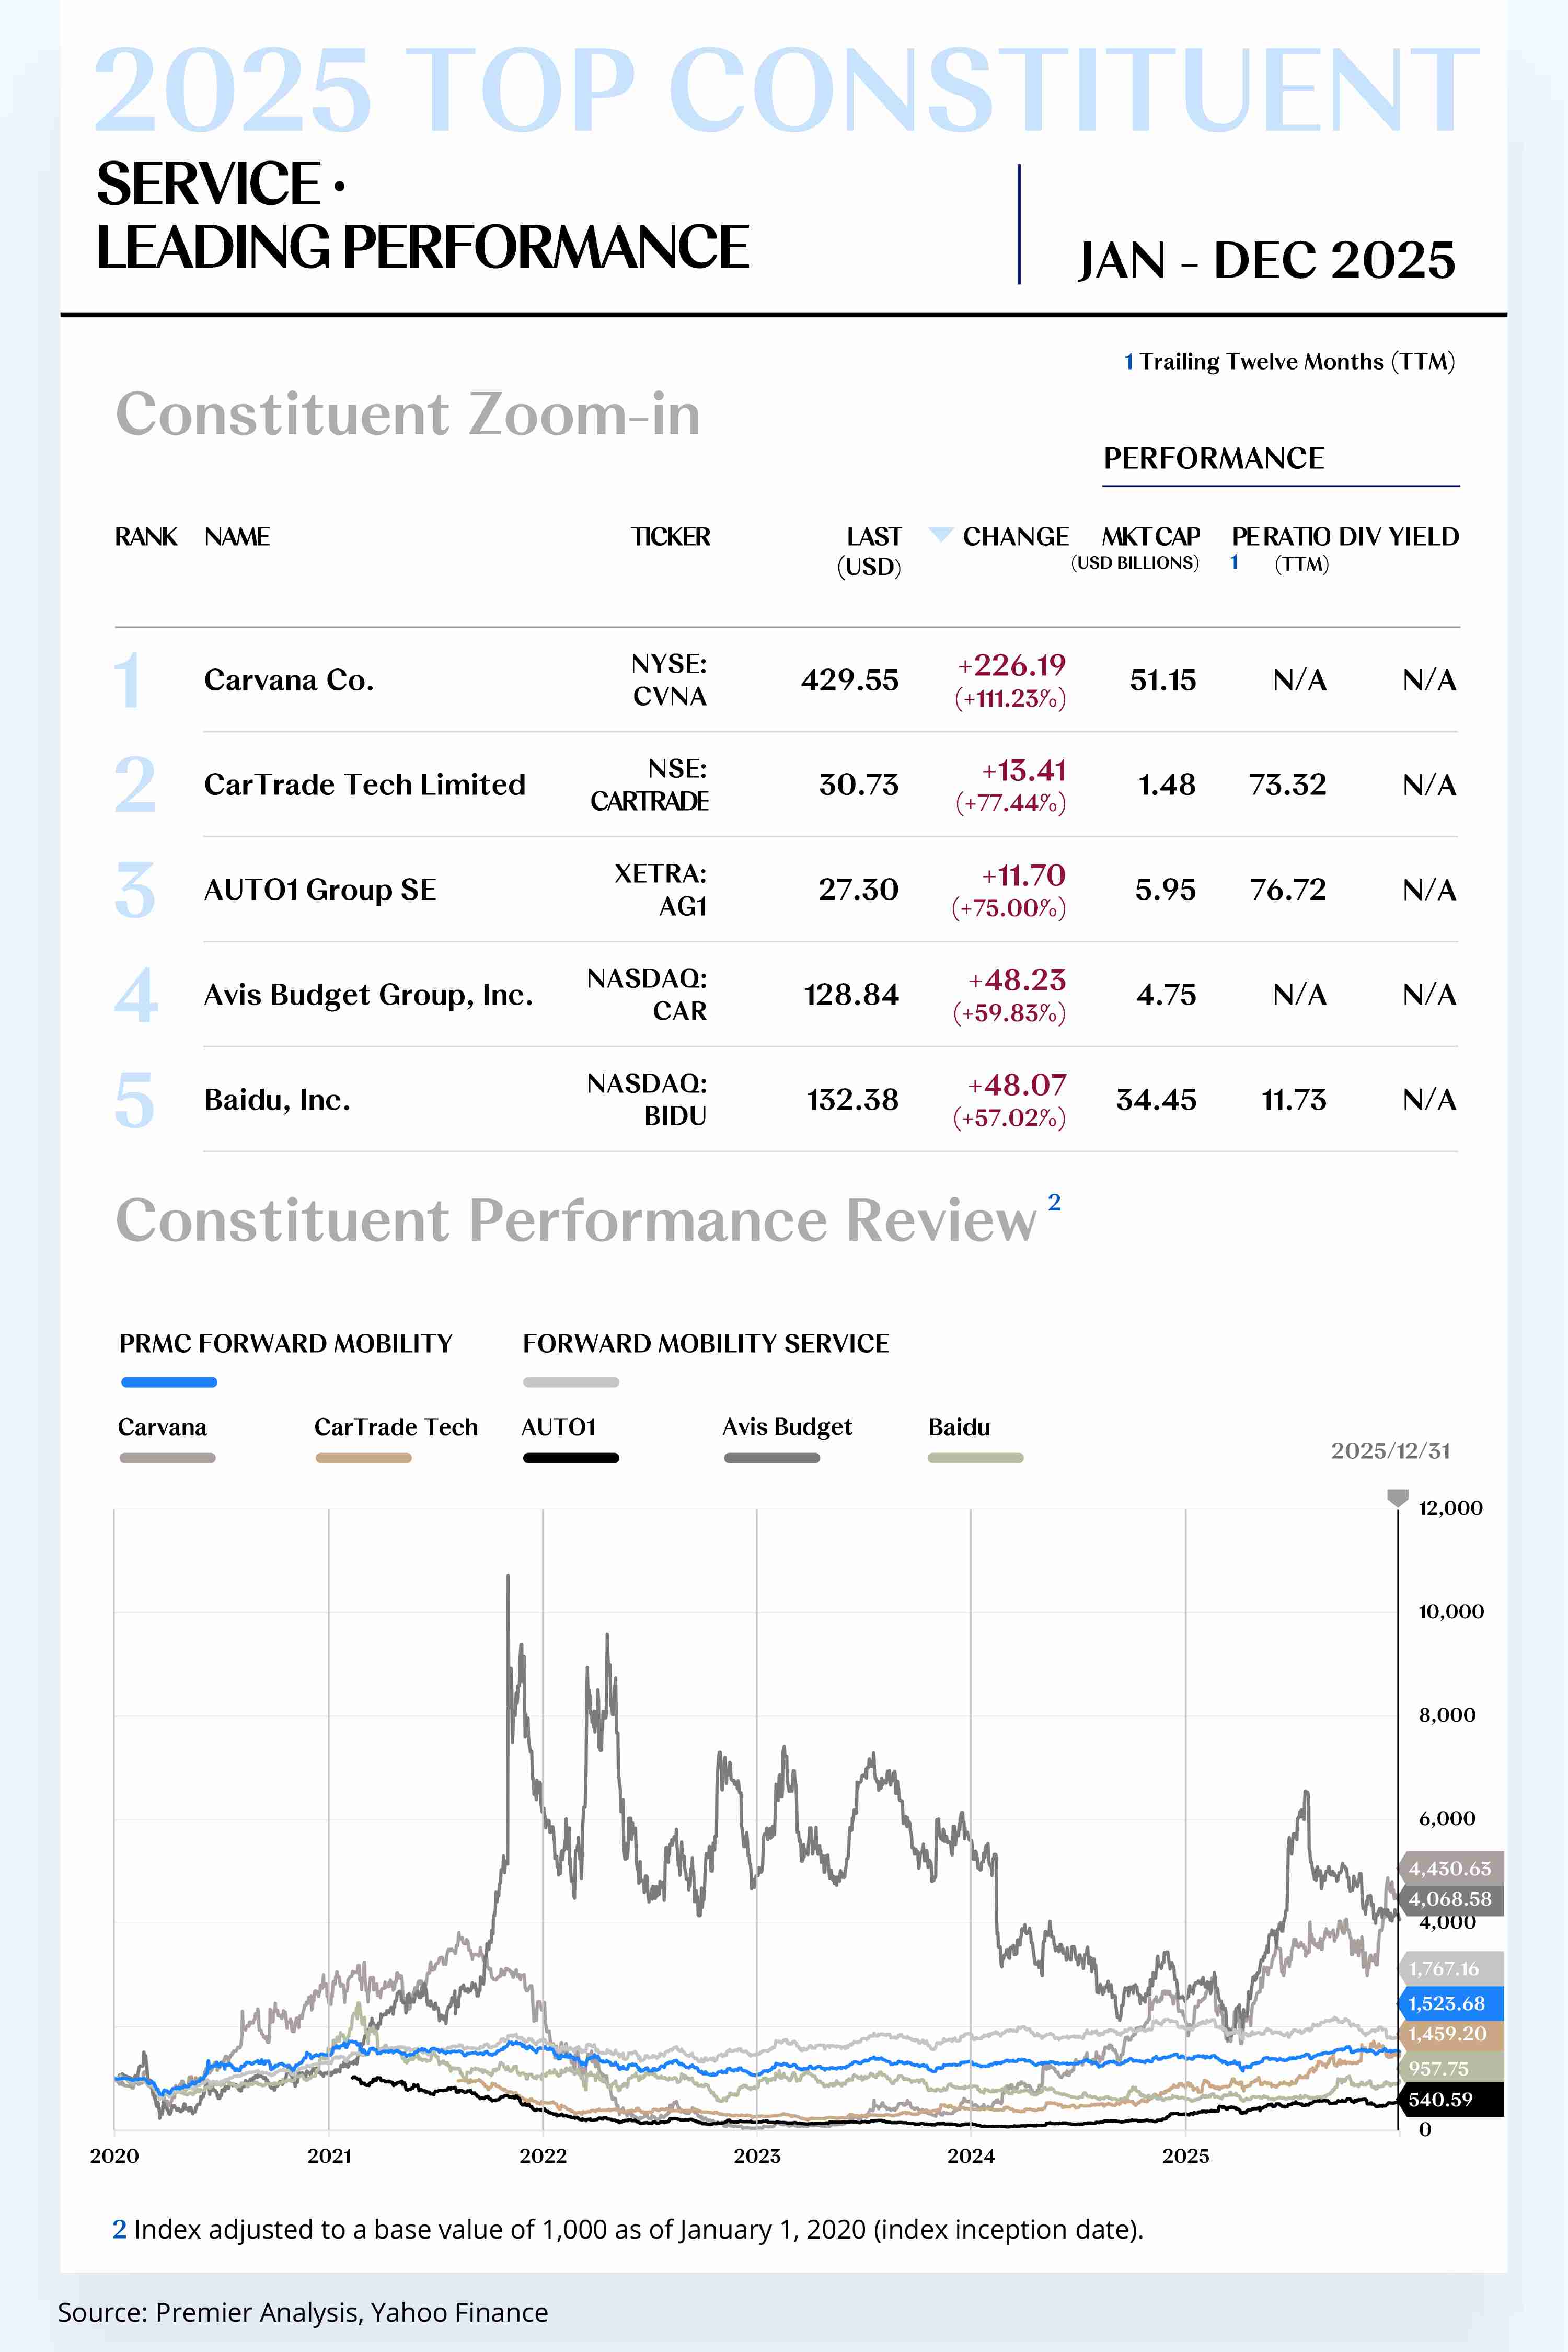
Leading Performers
1. Carvana Co. (NYSE: CVNA)
Carvana is an online used-car retailer headquartered in Tempe, Arizona, offering a “one-stop” car-buying experience through its self-built e-commerce platform. For full year 2025, the company’s share price rose by US$226.19 to close at US$429.55, an annual increase of 111.23%.
On May 7, the company released its first-quarter 2025 results: retail unit sales of 133,898, up 46% year over year; revenue of US$4.232 billion, up 38% year over year; net income attributable to shareholders of US$373 million; and adjusted EBITDA of US$488 million.
On October 29, the company reported third-quarter 2025 results: retail unit sales of 155,941, up 44% year over year; revenue of US$5.647 billion; net income attributable to shareholders of US$263 million; adjusted EBITDA of US$637 million; and indicated that full-year EBITDA would reach or exceed the upper end of prior guidance.
Overall in 2025, Carvana achieved a key leap toward a “high-operating-leverage profitability model” through rapid sales growth, improvements in reconditioning and logistics efficiency, and a systemic restoration of liquidity channels in auto finance.
Looking ahead to 2026, Carvana’s core strategy will center on three pillars: “efficiency amplification + capital structure repair + platform scale-up.”
At the operating level, as the nationwide logistics network, ADESA reconditioning capacity, and same-/next-day delivery coverage continue to expand, the company is expected to further improve vehicle turn rates and per-vehicle gross profit, and amplify adjusted EBITDA operating leverage via platform scale effects.
In finance and capital structure, supported by approximately US$14 billion of loan-sale channels with Ally and new partners, the company will have more stable monetization of retail and financial assets, and can continue to improve free cash flow and leverage metrics through debt refinancing, maturity extension, and interest cost reduction.
2. CarTrade Tech Ltd. (NSE: CARTRADE)
CarTrade Tech is a leading automotive marketplace in India, covering new and used vehicle buying/selling, auctions, and valuation services, connecting consumers, dealers, and financial institutions. Leveraging digital technology and a multi-brand ecosystem, the company aims to improve transaction efficiency and provide end-to-end solutions. For full year 2025, the company’s share price rose by US$13.41 to close at US$30.73, an annual increase of 77.44%.
On May 7, the company reported full-year and fourth-quarter FY2025 results: full-year revenue of INR 7.11 billion, up 28% year over year, and net profit attributable to the parent of INR 1.45 billion, a substantial increase versus last year; in Q4 specifically, revenue reached INR 1.89 billion with net profit attributable to the parent of INR 460 million, reflecting continued improvement in platform scale and unit economics.
From June 24 to 26, the company announced the establishment of CarTrade Labs, designating generative AI, data science, and valuation/pricing engines as the group-level technology foundation to provide unified algorithms and risk-control capabilities across businesses including CarWale, BikeWale, OLX India, and Shriram Automall.
Overall in 2025, CarTrade Tech successfully transformed from a “growth platform” to a “high-cash-flow platform” through technology platform upgrades, scale-up of auction and classifieds businesses, and strict expense and capital discipline.
Looking ahead to 2026, CarTrade Tech’s core growth logic will upgrade from a “traffic platform” to an “algorithm-driven automotive asset circulation infrastructure.”
On the demand side, as used vehicles, EVs, and cross-state transactions in India continue migrating online, the company plans to push annual platform transaction volume to around 2 million vehicles and lift EV-related transactions to over 20%.
[For more insights, please download the full report]
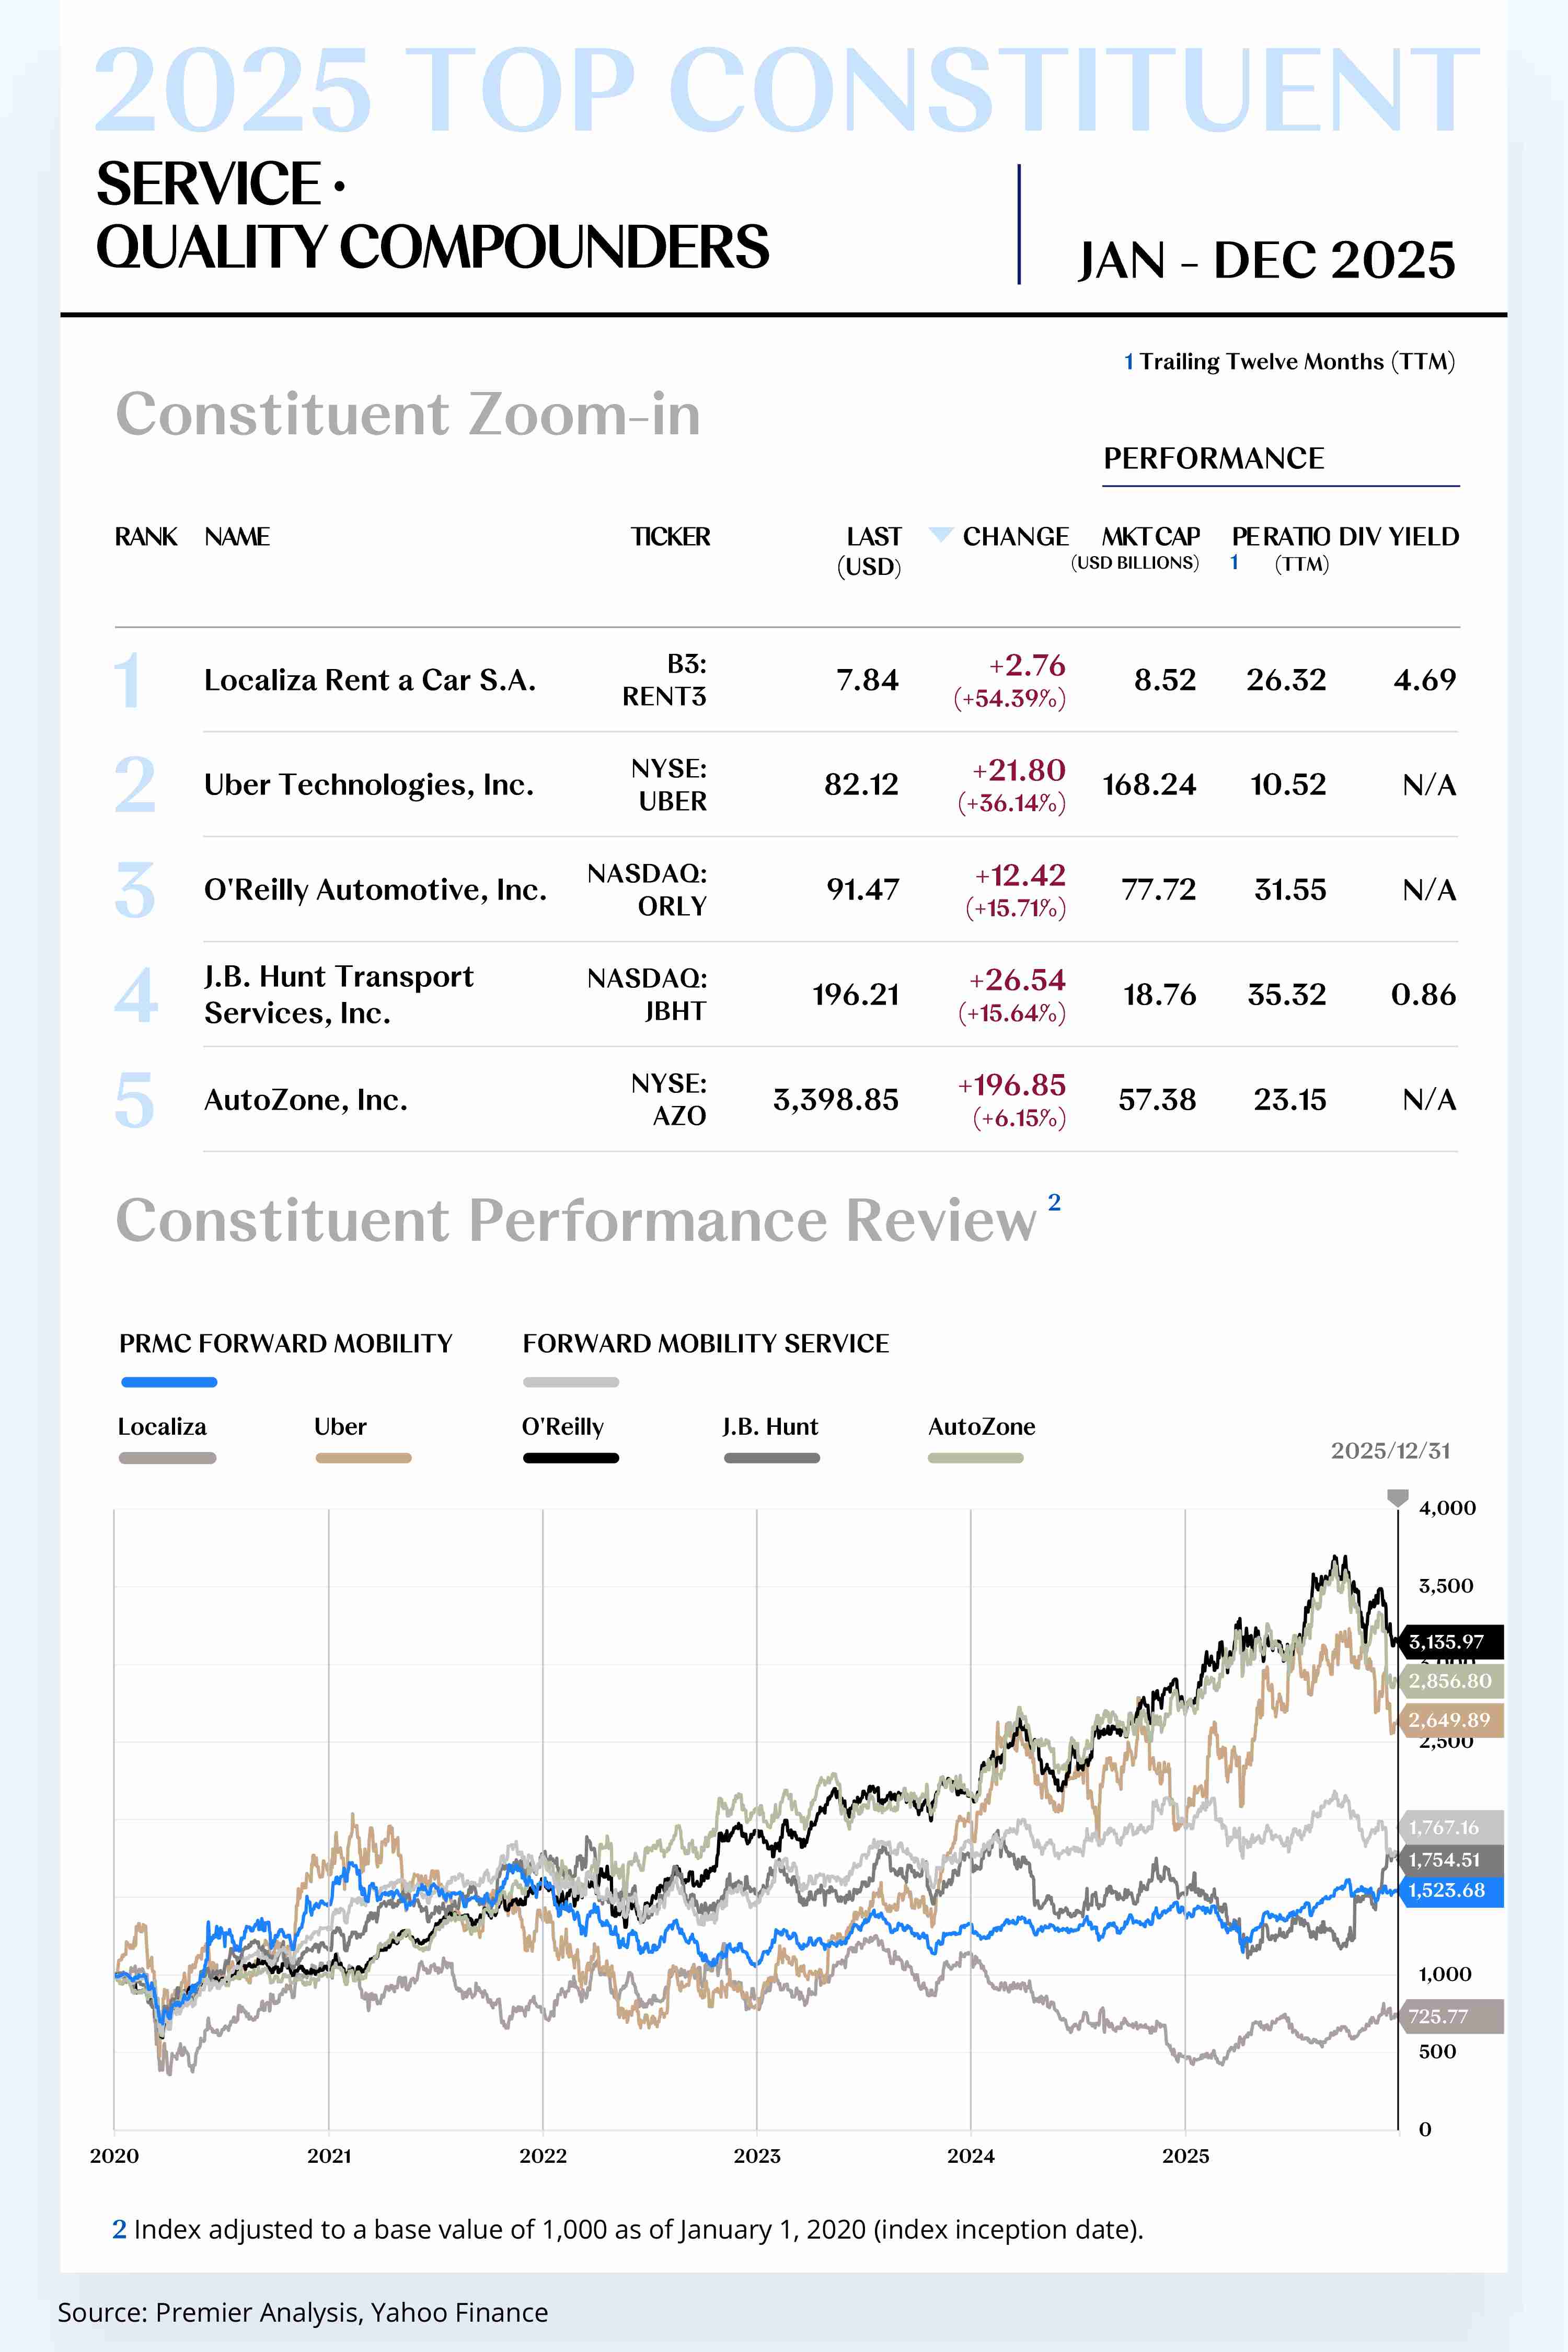
Quality Compounders
1. Localiza&Co (B3: RENT3)
Localiza&Co is a Brazil-headquartered vehicle rental company and one of the largest car rental platforms in Latin America. For full year 2025, the company’s share price rose by US$2.76 to close at US$7.84, an annual increase of 54.39%.
On May 9, the company disclosed first-quarter 2025 results: net revenue of BRL 10.1 billion, up 16.7% year over year, and net income of BRL 842 million, up 14.8% year over year.
On August 11, the company released second-quarter 2025 results: net revenue of BRL 9.9 billion and EBITDA of approximately BRL 3.3 billion. The company also reported record highs in digital pickup processes, with Localiza Labs continuously iterating subscription apps and customer interfaces, driving simultaneous improvements in customer experience and frontline operational productivity.
On December 12, the board approved a share repurchase program of up to 72 million shares, signaling a commitment to enhance shareholder returns through capital returns and equity structure optimization, and to reinforce capital market confidence during the profit recovery phase.
Looking ahead to 2026, as Localiza’s green financing and sustainability-linked framework with IFC enters execution, the company will steadily increase the penetration of low-emission and new energy models in its fleet and benefit in Brazil and across major Latin American markets from the expansion of charging infrastructure and improving regulatory conditions.
Operationally, the company plans to further deepen the application of AI pricing, intelligent dispatching, and digital pickup systems to continuously improve fleet utilization, customer retention, and operating efficiency, thereby optimizing per-vehicle profitability and cost structure.
In channels and markets, leveraging its existing networks in Brazil, Argentina, and Chile, the company will increase the density of direct-operated outlets and expand B2B and subscription offerings for enterprise customers to drive higher transaction volumes and improve unit economics.
2. Uber Technologies, Inc. (NYSE: UBER)
Uber is a global leading mobility technology platform providing diversified services—including ridesharing, food delivery, and freight—via its mobile applications, covering about 70 countries and more than 15,000 cities worldwide. For full year 2025, the company’s share price rose by US$21.80 to close at US$82.12, an annual increase of 36.14%.
On May 1, the company announced a multi-year strategic partnership with May Mobility, confirming that an autonomous fleet would go live on the platform in Arlington, Texas by year-end, with gradual expansion to more U.S. cities—formally introducing Level 4 autonomous capabilities into everyday mobility networks.
On May 6, the company announced plans to acquire approximately 85% of Trendyol GO for about US$700 million in cash. Upon closing, Uber would formally enter Turkey’s food delivery and quick commerce market, further expanding its global local-services footprint.
On May 14, at the “Go Get 2025” product event, the company launched new commute-oriented offerings, including Route Share fixed shared-ride service, Price Lock Pass, and prepaid commute cards, while rolling out an AI-based commute reminder system and Commute Hub—enhancing user experience across price certainty and commute efficiency.
On July 17, the company, Lucid, and Nuro jointly unveiled a next-generation Robotaxi solution, with Uber investing US$300 million in Lucid. The agreement calls for deploying at least 20,000 Level 4 autonomous vehicles on the platform over the cycle, with initial vehicles launched in major U.S. cities—signaling the onset of scalable Robotaxi replication.
On October 2, the company completed the acquisition of Segments.ai, integrating its team into Uber AI Solutions to strengthen lidar and multi-sensor data labeling capabilities that underpin autonomous driving and robotics training systems.
On November 26, the company and WeRide launched fully driverless, Level 4 Robotaxi commercial operations in Abu Dhabi, prioritizing matches via an “Autonomous” option in the app—marking the first fully driverless, city-level deployment outside the United States.
Looking ahead to 2026, Uber will continue to drive growth along two main lines: strengthening profitability and upgrading its technology platform. As demand in rides and delivery continues to recover, gross bookings and adjusted EBITDA are expected to trend steadily upward, providing sustained cash flow to support investment in autonomy and AI infrastructure.
In technology and networks, Uber expects to replicate its validated Robotaxi business model in more cities across the U.S. and the Middle East, expanding the density of the driverless network using vehicles and systems sourced from Lucid, Nuro, Stellantis, and WeRide—moving autonomous mobility from pilot demonstrations toward commercialization with real unit economics.
[For more insights, please download the full report]
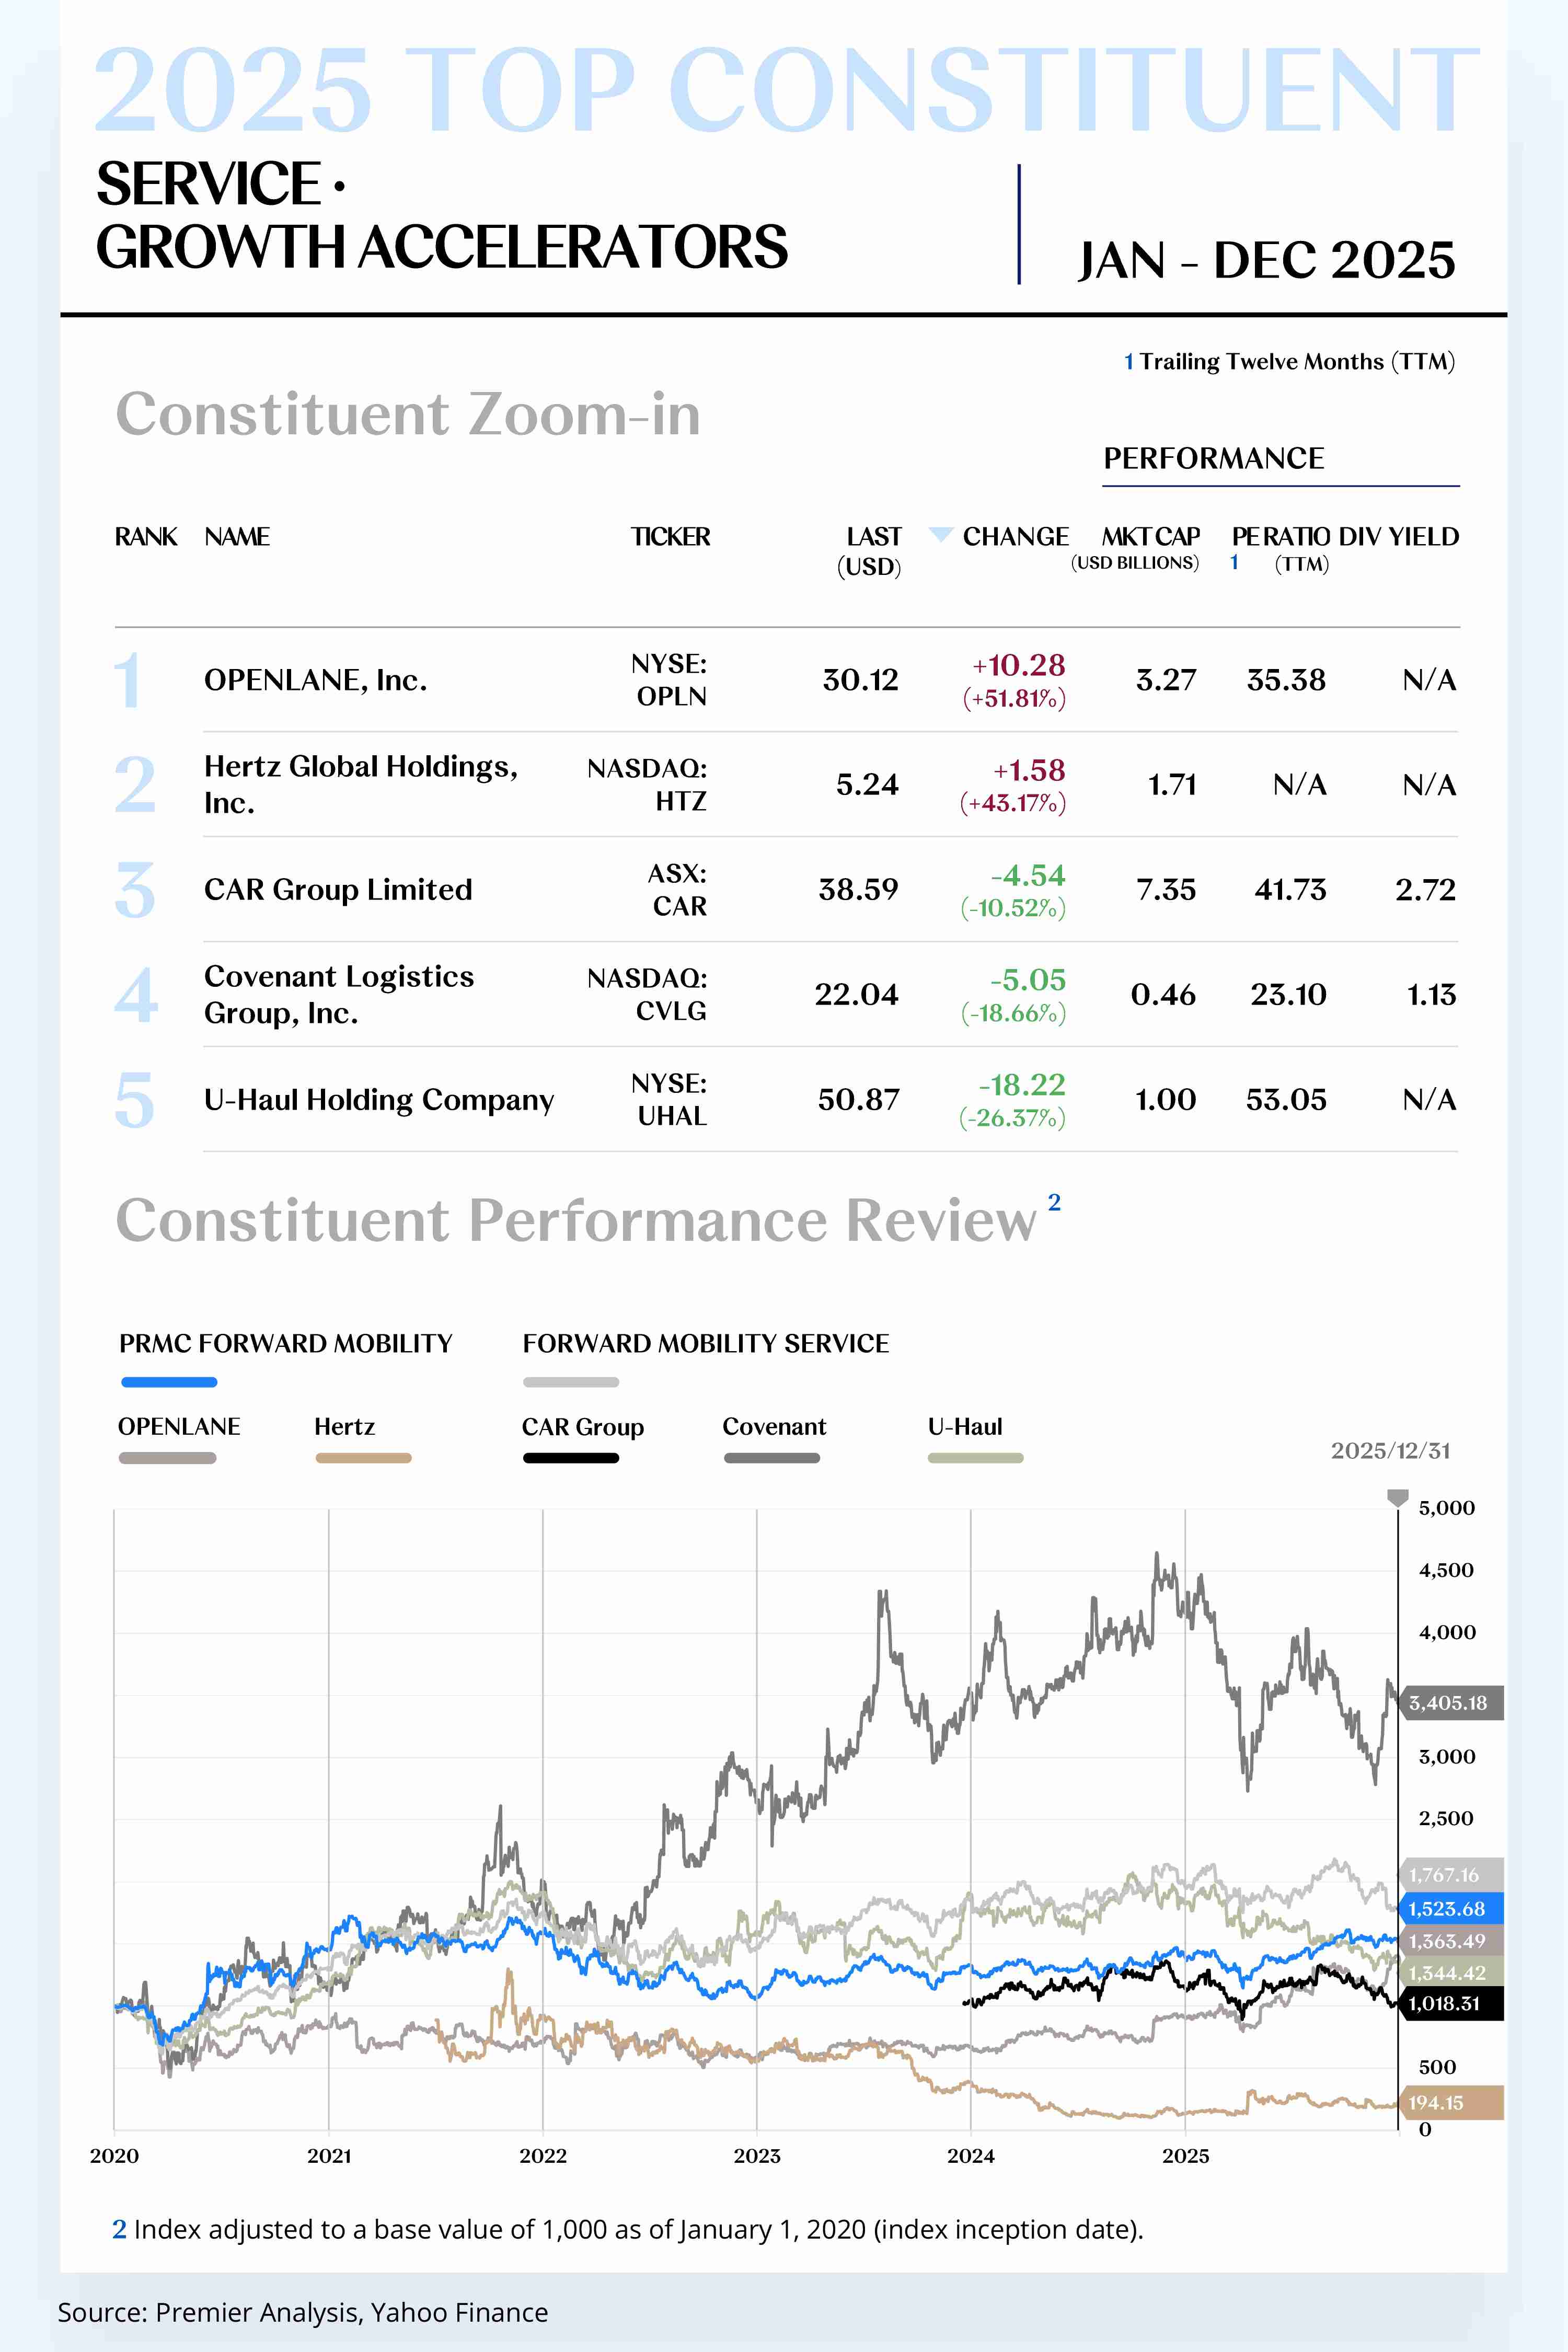
Growth Accelerators
1. OPENLANE, Inc. (NYSE: OPLN)
OPENLANE specializes in automotive auctions and remarketing services, providing digital used-vehicle transaction solutions to dealers, leasing companies, and fleet management firms. For full year 2025, the company’s share price rose by US$10.28 to close at US$30.12, an annual increase of 51.81%.
On May 7, the company reported first-quarter 2025 results: revenue of US$460 million, up 7% year over year; Marketplace revenue up 10%; dealer transactions up 15%; adjusted EBITDA of US$83 million (up 11% year over year); and an additional US$250 million share repurchase authorization to enhance capital allocation efficiency.
On September 3, the company launched “Audio Boost AI” on its U.S. Marketplace, which compares more than 1.2 million engine audio samples to highlight anomalies in inspection reports, helping improve appraisal efficiency and transaction confidence.
Looking ahead to 2026, OPENLANE is poised to sustain steady growth. Driven by a supply–demand recovery in North American and Canadian used-car markets, faster fleet and rental channel de-fleeting, and rising online auction penetration, platform transaction volume and per-unit service revenue are expected to rise in tandem. The company will leverage digital- and AI-driven valuation and inspection tools, intelligent matching mechanisms, and standardized/automated reconditioning and inspection processes to improve transaction efficiency and pricing transparency, thus optimizing gross margin structure.
2. Hertz Global Holdings, Inc. (NASDAQ: HTZ)
Hertz Global Holdings is a leading global vehicle rental company whose core businesses span short-term rentals, long-term leasing, and fleet management, with a service network across North America, Europe, Asia, and other regions. For full year 2025, the company’s share price rose by US$1.58 to close at US$5.24, an annual increase of 43.17%.
On May 7, the company announced first-quarter 2025 results with revenue up about 5% year over year and launched EV-exclusive rental packages in the European market. On June 12, the company completed the acquisition of a U.S. fleet management company, strengthening its enterprise customer capabilities.
On November 6, the company reported third-quarter results with continued revenue growth and announced the launch of EV rental operations in Latin America. On December 18, at its annual strategy day, the company set 2026 targets: raising EVs to 35% of the fleet, accelerating digital transformation, and advancing global expansion.
Over the year, the company pushed forward EV rentals and digital operations via strategic partnerships, acquisitions, and technology upgrades, consolidating its competitiveness in the global car rental market.
Looking ahead to 2026, Hertz expects steady growth, benefiting from sustained recovery in global car rental demand and accelerating EV penetration. EVs are expected to exceed 35% of the fleet, advancing the company’s green mobility strategy and further enhancing environmental and social responsibility performance.
Operationally, the company will deepen digital transformation, using AI-driven dynamic pricing and intelligent fleet dispatching to continuously optimize operating efficiency, reduce unit costs, and improve customer service levels.
[For more insights, please download the full report]
MACROECONOMY UPDATES
Structural Reshaping and Resilience Forging in Parallel;
Charting the Path Forward Amid Uncertainties
Global Economy Growth
Global: Structural Adjustment and Resilience Testing Coexist;
Seeking Growth Amid Uncertainties in 2026
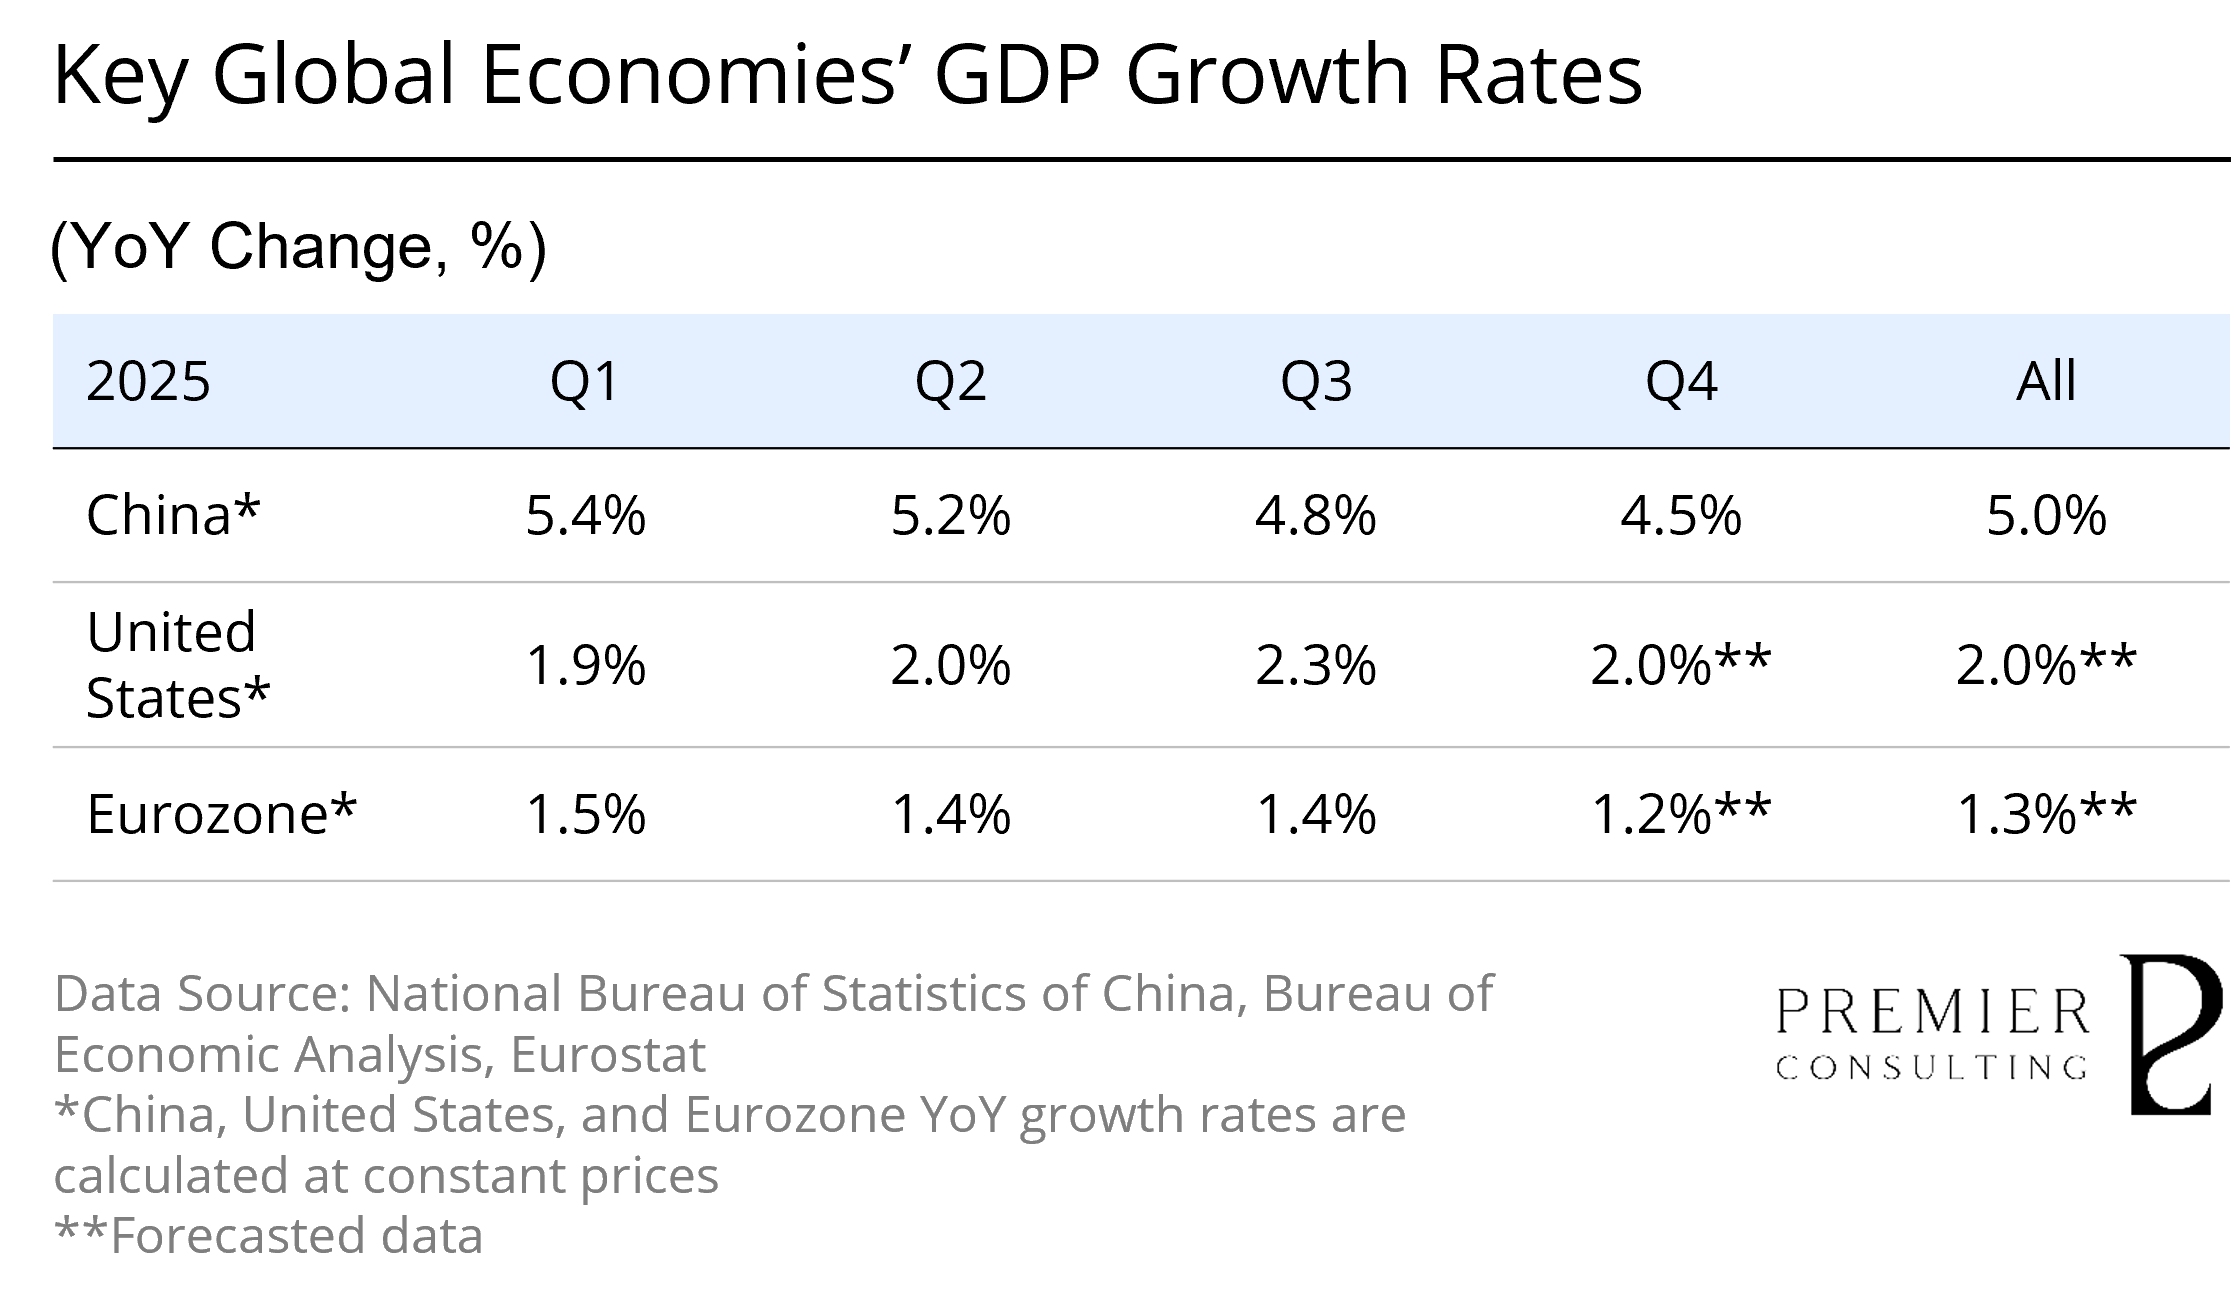
Following the fluctuations of 2023–2024, the global economy in 2025 demonstrates a warming and expansionary trend. Institutions such as the International Monetary Fund project full-year global growth to stabilize within the 3.1%–3.2% range—still below historical averages—yet exhibiting certain resilience against the backdrop of trade frictions, energy price volatility, and geopolitical tensions.
Developed economies show relatively subdued growth, while emerging markets and developing economies maintain higher growth rates, providing robust support for the overall global expansion. Global inflation exhibits a gradual downward trajectory, though significant disparities persist across regions. Core inflation in certain developed economies remains above target levels, and inflation in many emerging economies shows notable declines. Global trade volume faces shocks from uncertainties such as tariff barriers, yet the coordinated policy adjustments and supply chain restructuring among major economies have preserved the basic stability of trade flows.
At the policy level, major central banks have fine-tuned their monetary control mechanisms and counter-cyclical policies. The Federal Reserve and the European Central Bank, while maintaining stable policies, simultaneously attend to the balance between growth and financial stability, creating a "tolerance space" of moderate volatility for capital markets and bond markets. Additionally, ample global market liquidity and resilient corporate earnings underpin the overall performance of major commodities and risk asset prices, reflecting the market's phased expectations of uncertainty.
[For more insights, please download the full report]
Manufacturing Purchasing Managers' Index Review
China: Empowering Technology and Structural Adjustments,
Focusing on Quality Improvement and Global Competition
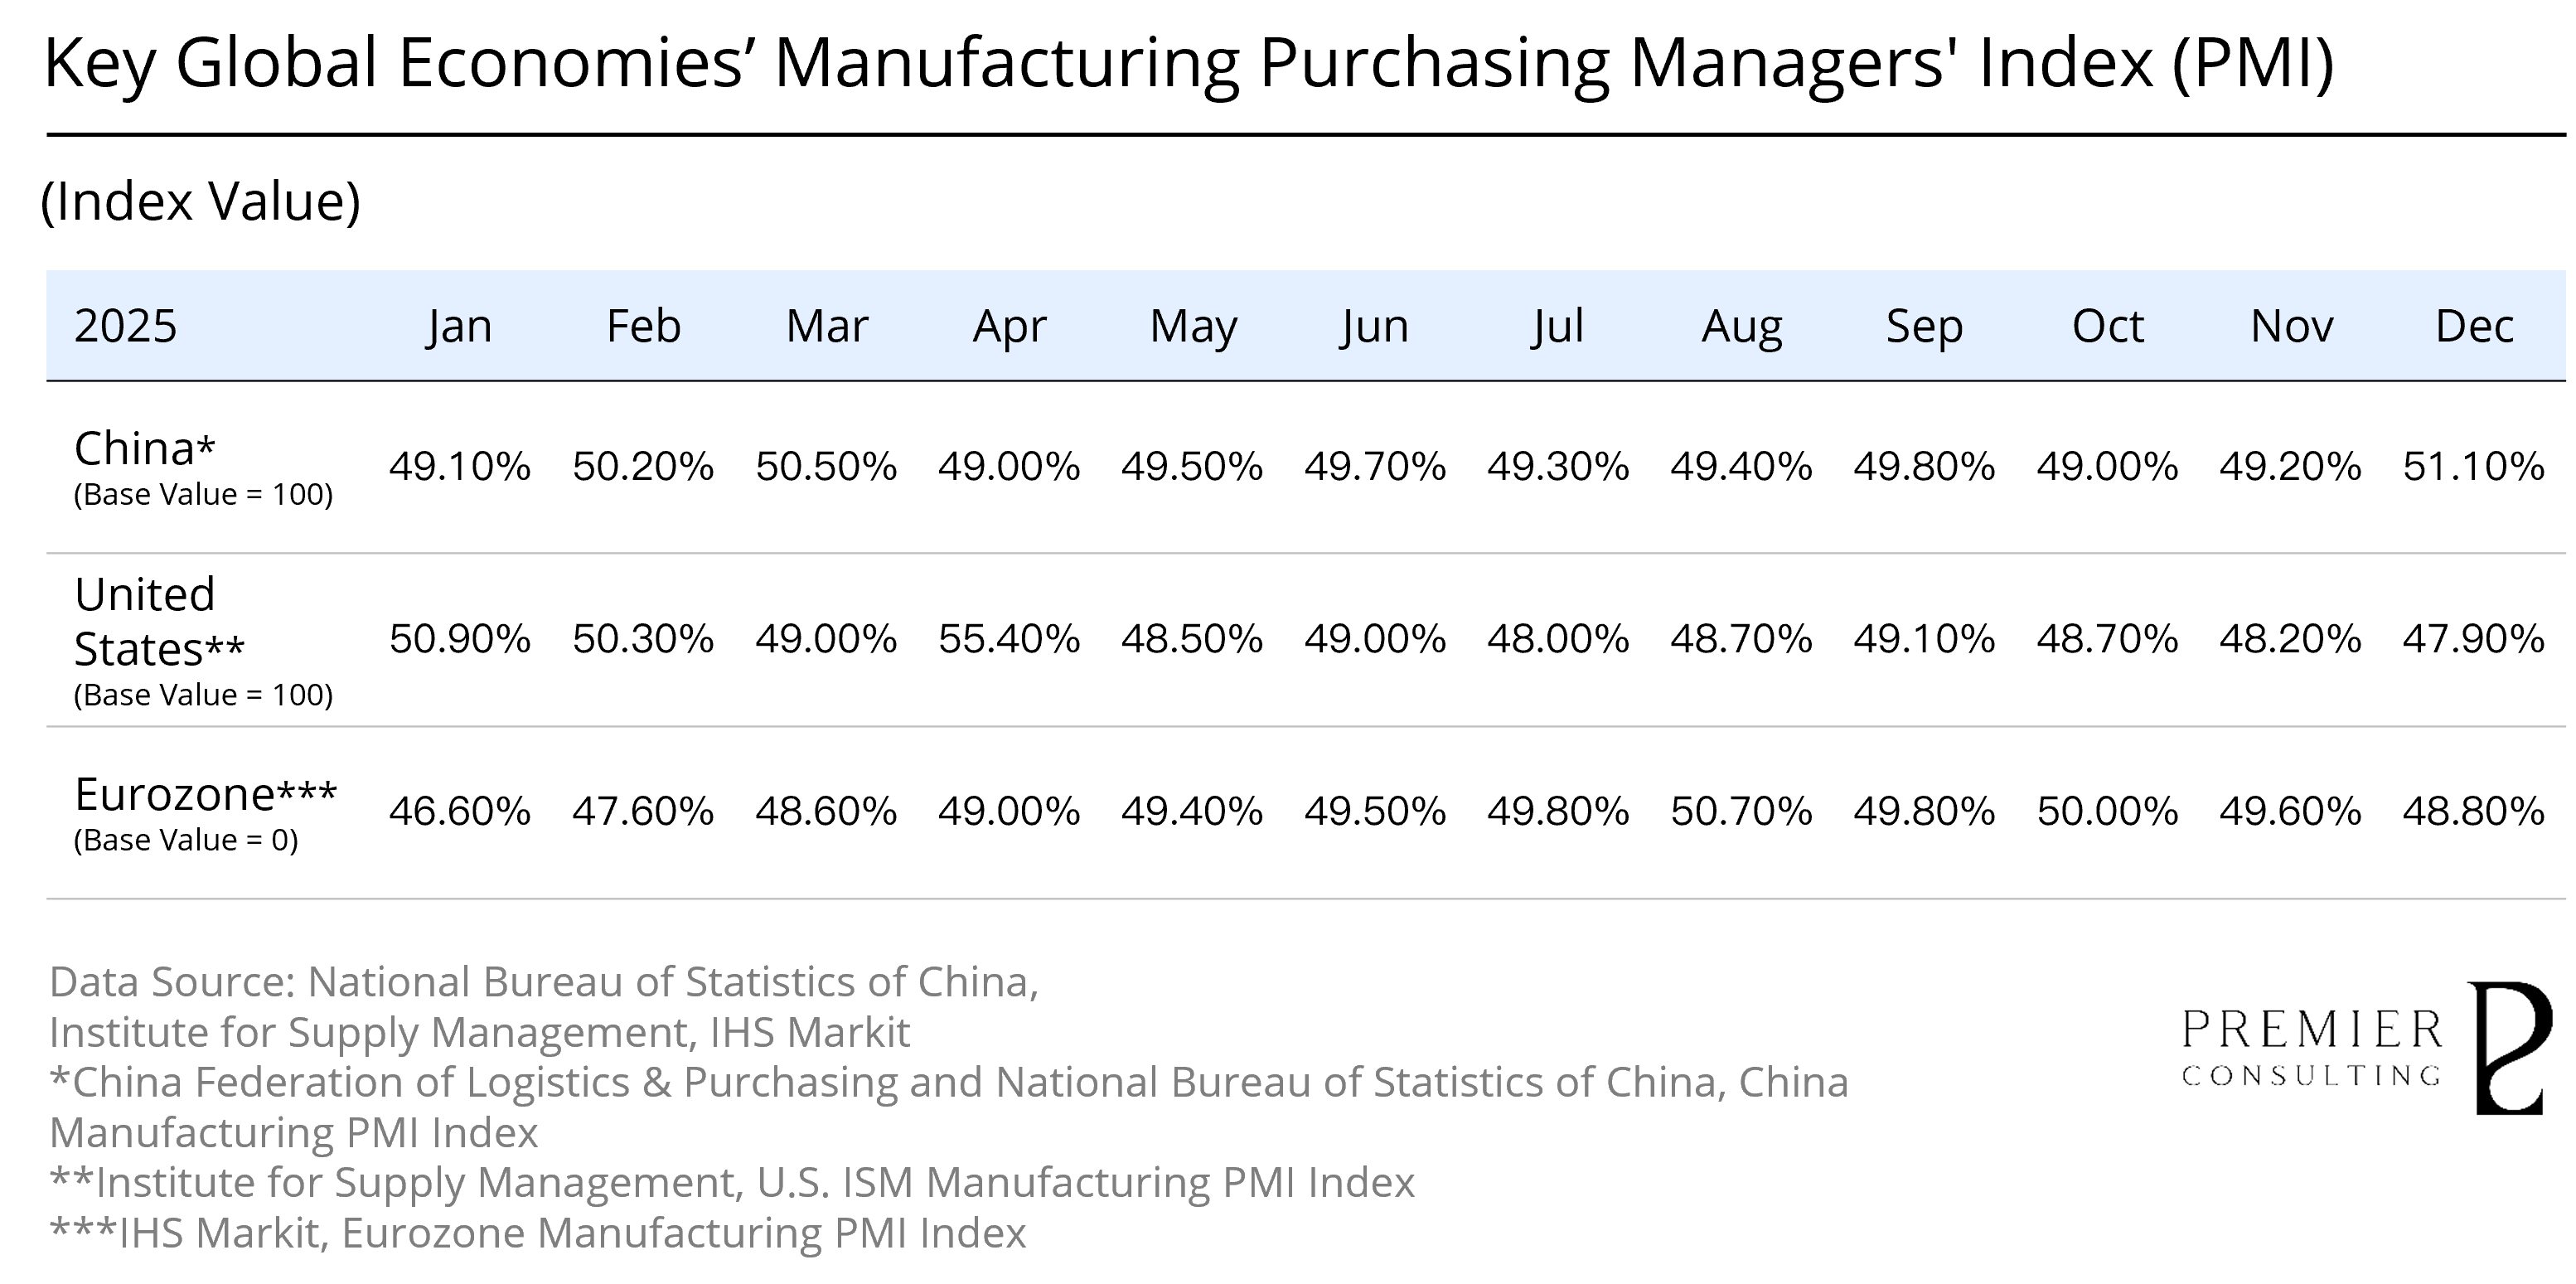
In 2025, the overall operation of China's manufacturing sector exhibited characteristics of stability with changes and structural differentiation. Despite the dual pressures of a global economic slowdown and weak domestic demand, it maintained a degree of resilience. From January to November, large-scale industrial enterprises achieved operating revenues of 125.34 trillion yuan, a year-on-year increase of 1.6%. The operating profit margin stood at 5.29%, a decrease of 0.08 percentage points year-on-year, indicating that the industrial system overall remained in an expansionary state.
At the same time, the growth rate of the manufacturing sector demonstrated a pattern of "stability followed by weakness" throughout the year: in some months, industrial output growth fell to low levels, reflecting the drag of weak domestic demand and investment on the manufacturing sector. Key indicator PMI fell below the critical line of 50% at multiple points during the year, highlighting the continued downward pressure faced by overall manufacturing activity.
Technological and structural upgrades emerged as significant highlights for the manufacturing industry in 2025. With the accelerated promotion of industrial internet, 5G manufacturing scenarios, and smart factories, the digital transformation of manufacturing made substantial progress. Advanced and excellent intelligent plants and industrial 5G private network projects have been constructed on a large scale nationwide, enhancing the resilience of the manufacturing sector and its integration with technology. Additionally, high-end manufacturing fields such as electronic information manufacturing maintained high growth rates, with some sub-sectors significantly exceeding the overall value-added rate of manufacturing.
[For more insights, please download the full report]
Retail Sales Growth Review & Outlook
China: Synchronizing Momentum Recovery and Structural Upgrades,
Policy Benefits Support Bottoming Consumer Demand
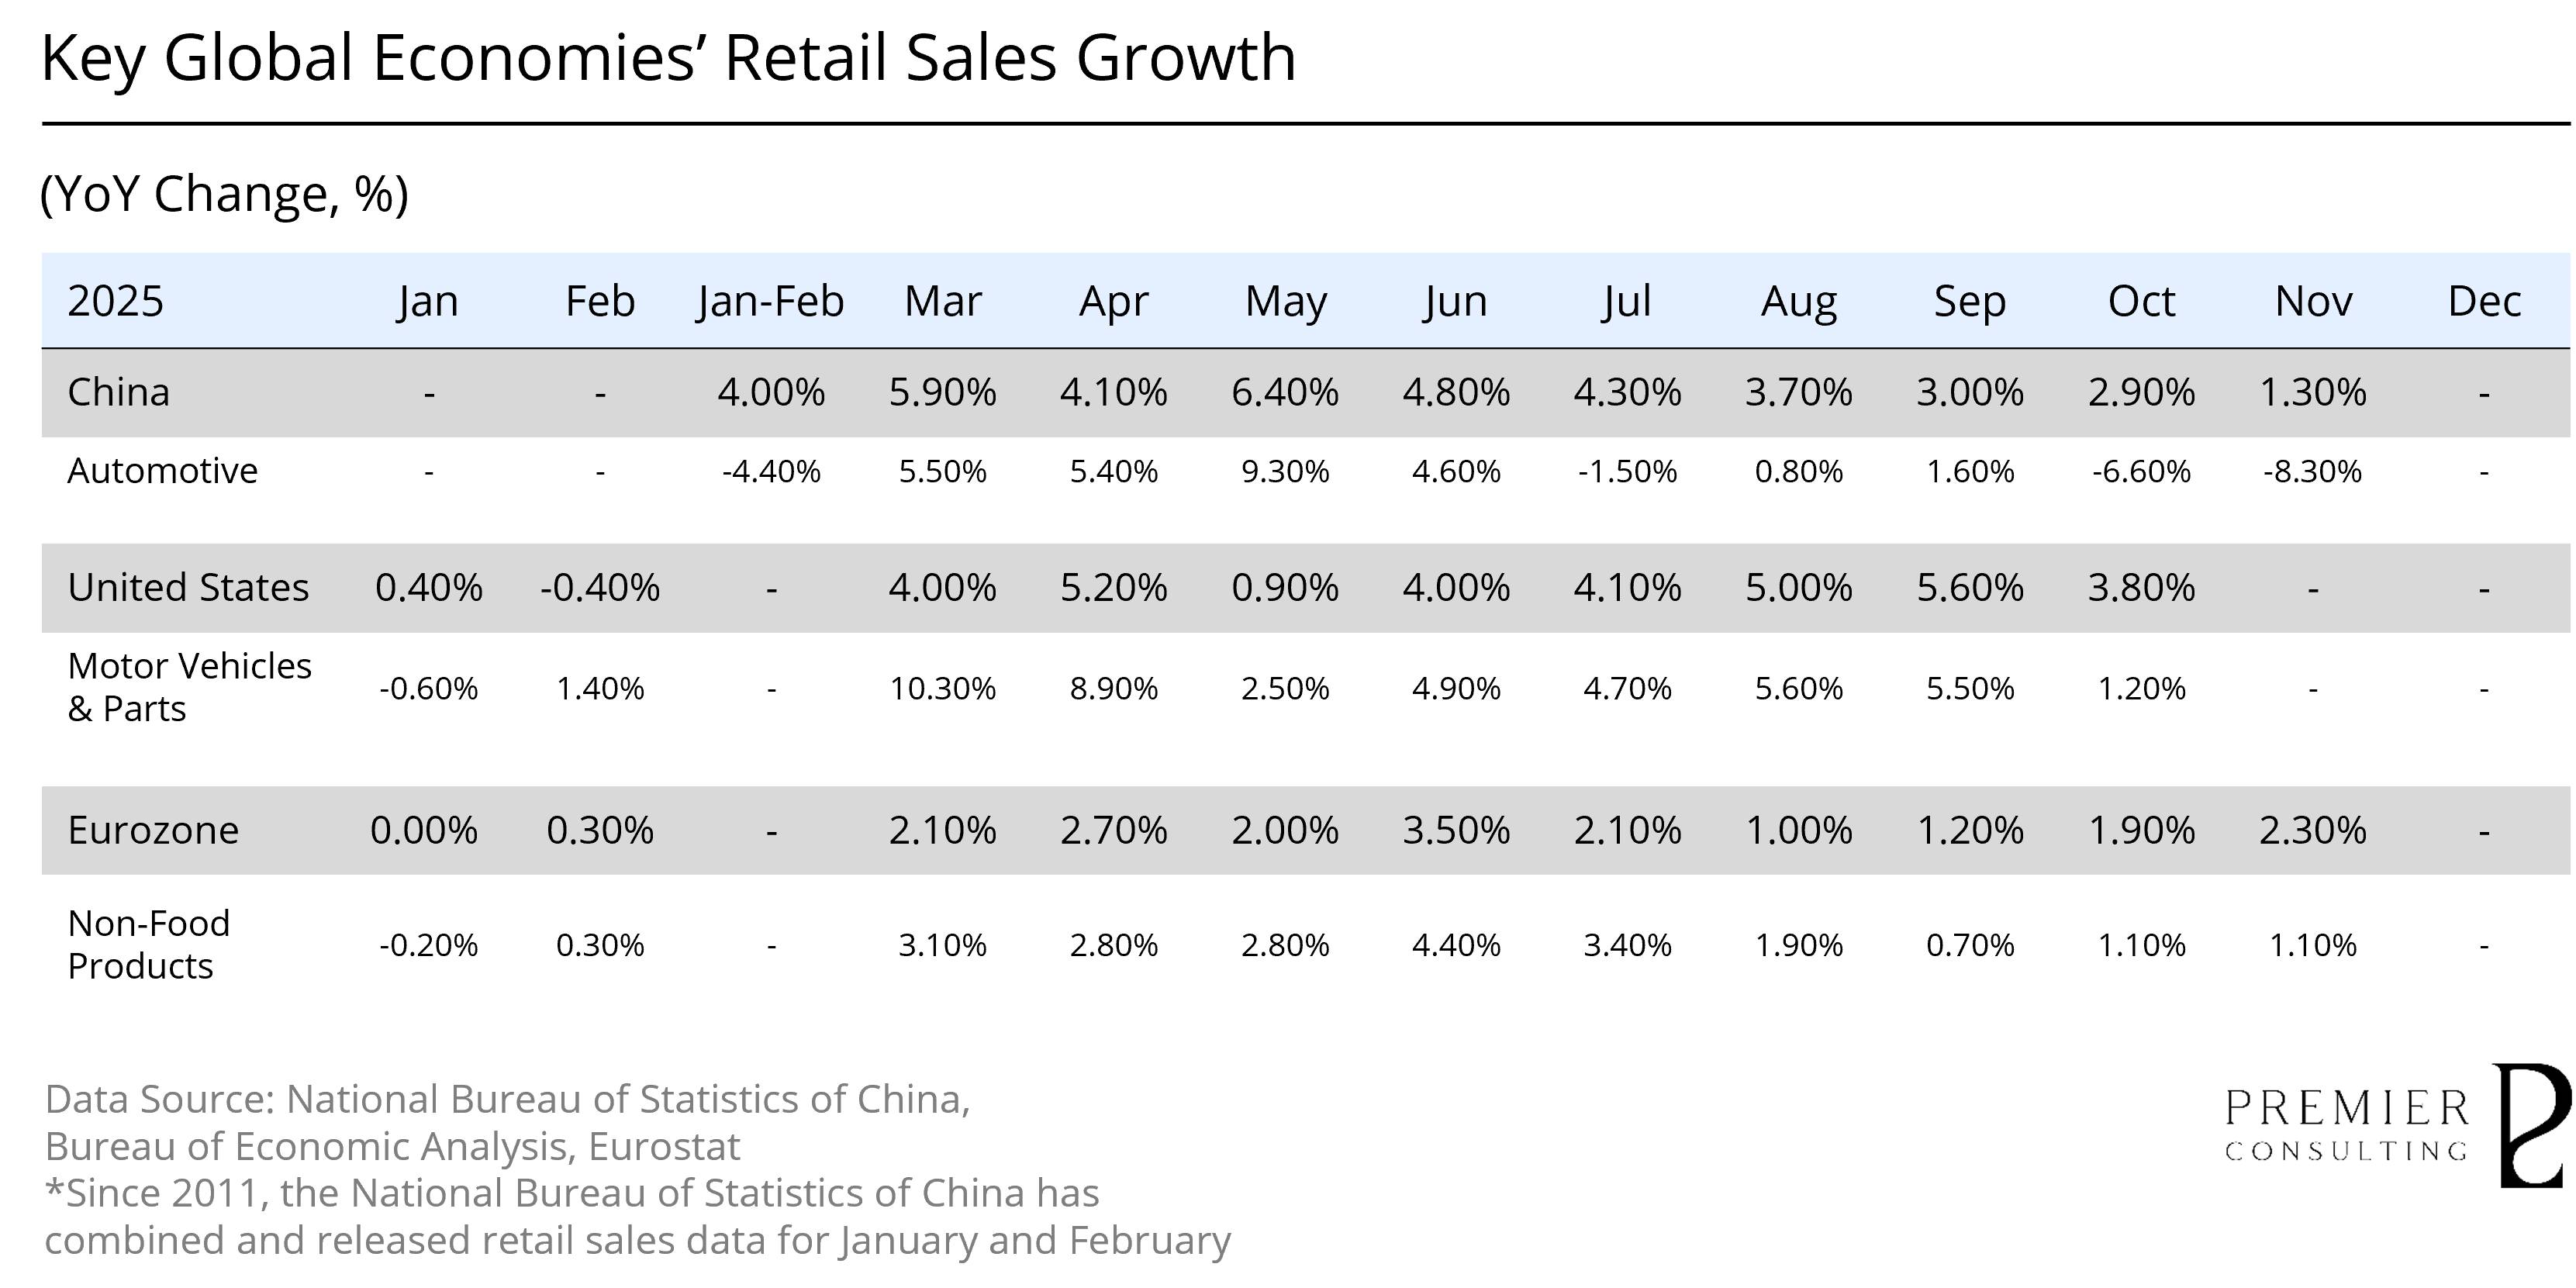
According to data released by the National Bureau of Statistics, from January to November 2025, China's total retail sales of consumer goods grew by approximately 4.0% year-on-year, showing an acceleration compared to 2024 and indicating overall resilience in consumption. The growth rate of retail sales excluding automobiles was even higher at around 4.6%, demonstrating robust traditional consumption, driven by rigid demand and service consumption. Subcategory data on social consumption also reflects structural improvements: service consumption, such as dining and sports entertainment, grew relatively quickly, and certain new categories like jewelry, sporting goods, cosmetics, and home appliances performed strongly.
In the structure of consumption, automotive consumption has become an important variable in the differentiation of consumer spending in 2025. Driven by policies such as vehicle trade-in programs, sales of related products exceeded 2.6 trillion yuan, benefiting over 360 million people, and shifting the overall consumption support toward durable goods like new cars and home appliances. The vehicle trade-in policy has directly facilitated large-scale transactions, with related replacement demand significantly released. By November 2025, new energy vehicles accounted for about 60% of trade-in exchanges, continuously increasing their penetration in the new car retail market.
[For more insights, please download the full report]

INDUSTRY KEY FIGURES
Supply and Demand Moving in Tandem;
Battery Electric Vehicles Leading
a New Chapter of Growth
Coordinated Growth on Both Supply and Demand Sides Throughout the Year; November Production Hits New High Amid Increasing Market Caution
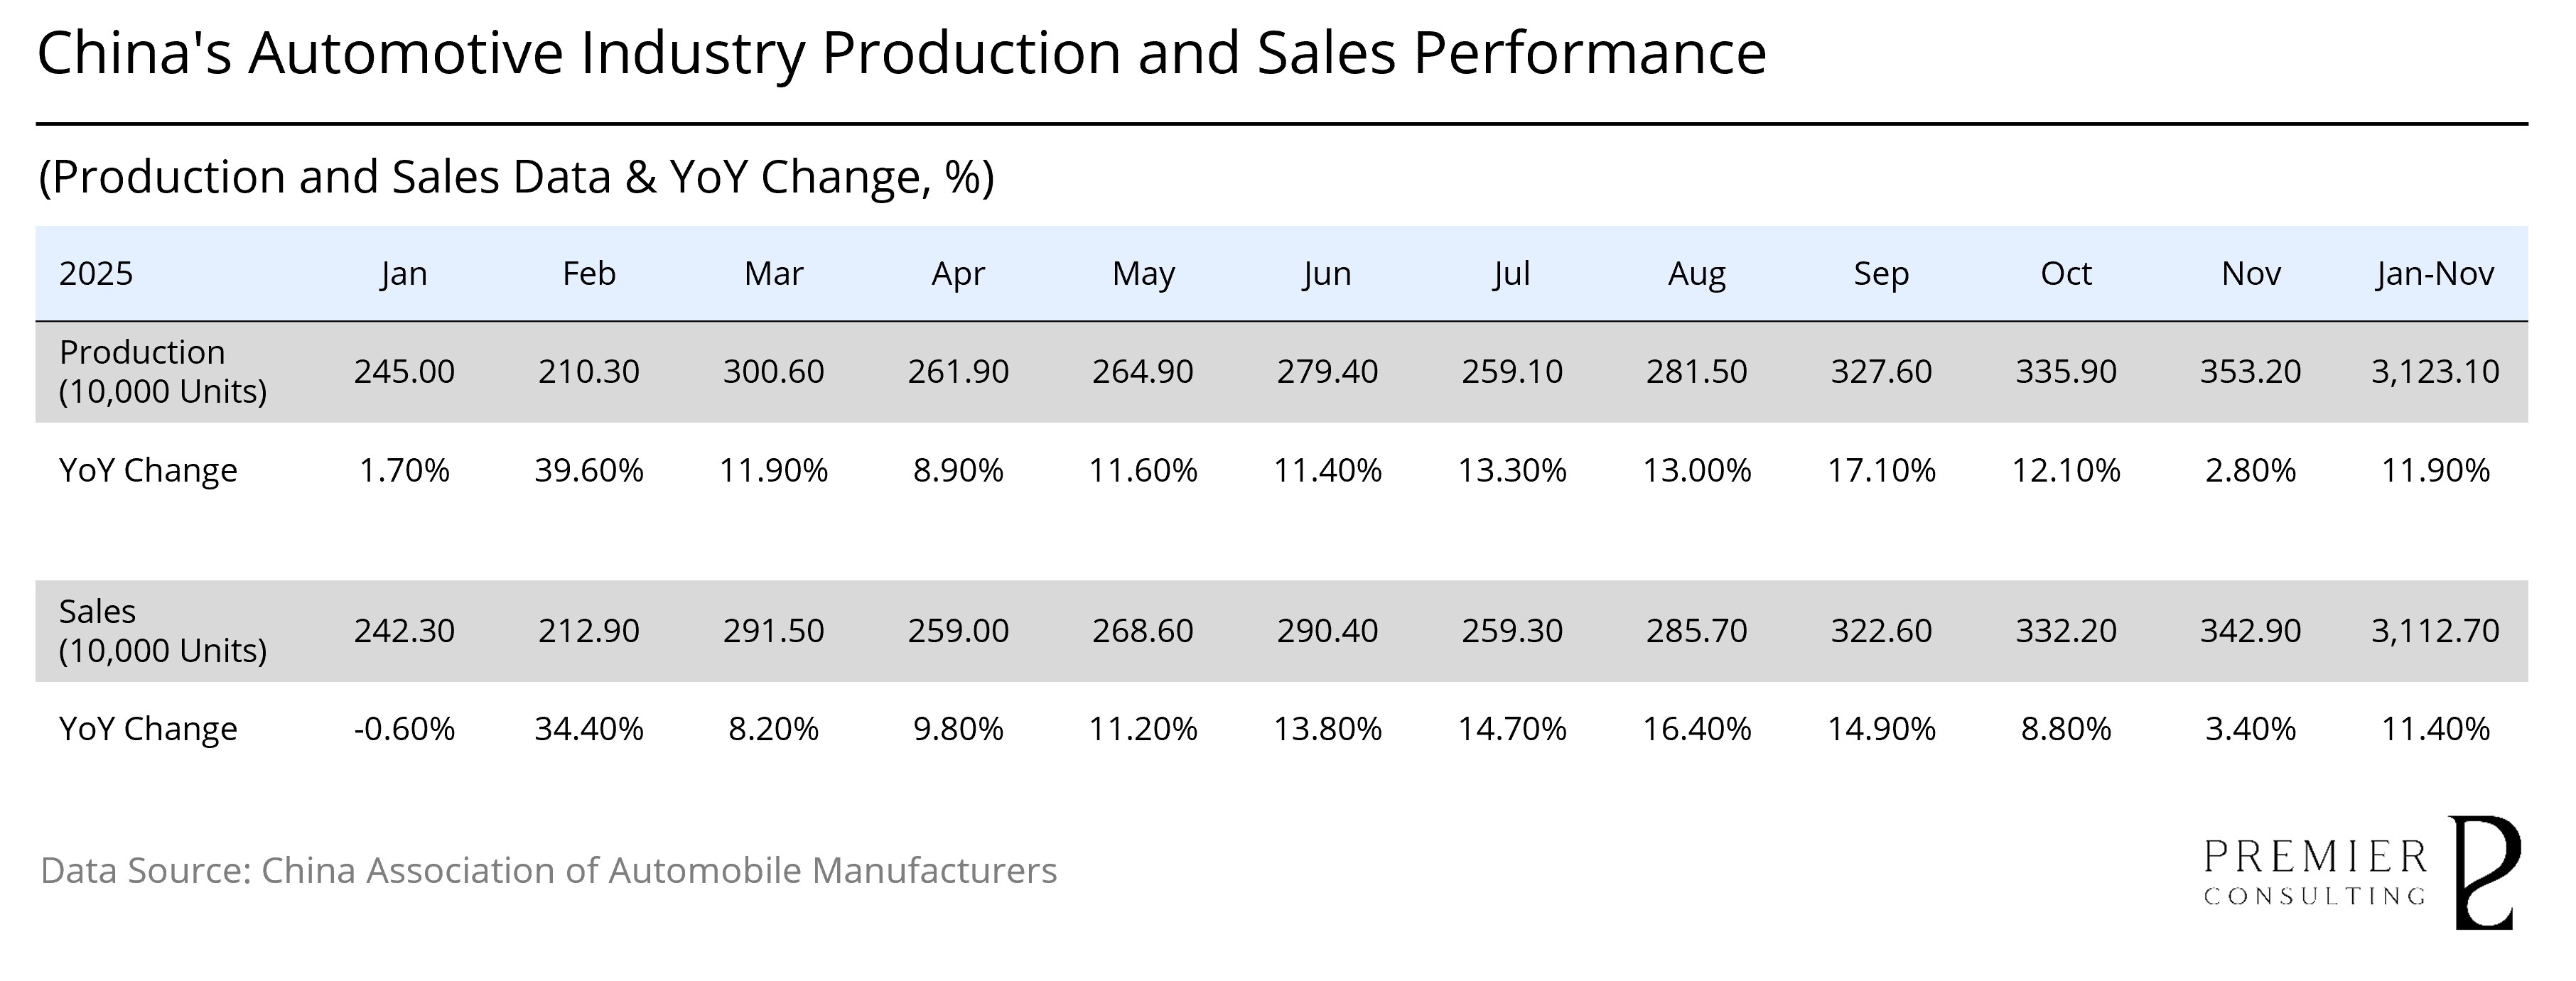
Reflecting on the overall performance of 2025, China’s automotive industry maintained steady growth. According to the latest data from the China Association of Automobile Manufacturers, from January to December 2025, the country’s automotive production and sales reached 34.531 million and 34.400 million units, respectively, representing year-on-year increases of 10.40% and 9.40%, surpassing early-year expectations.
The passenger vehicle segment also demonstrated robust growth, with annual production and sales of 30.270 million and 30.103 million units, showing year-on-year increases of 10.20% and 9.20%. These figures indicate that despite a complex market environment, overall industry demand remains solid, and supply and end consumption have largely achieved synchronized growth.
Monthly observations reveal that thanks to continuous policy incentives and subsidies, consumer willingness to purchase vehicles was effectively stimulated. Meanwhile, the rapid expansion of new energy vehicles released market demand, with the maturity of product lineups from various manufacturers and growth in end sales providing strong support for the industry, keeping production and sales growth rates high before October.
However, starting in November, as the intensity of policy stimulation weakened and consumer expectations regarding new car subsidy policies became unclear, a notable sense of caution emerged in the market, impacting purchase decisions. Additionally, influenced by the high base effect from the same period in 2024, monthly production and sales of automobiles experienced significant deceleration. Consequently, December saw further year-on-year declines in monthly production and sales.
Looking ahead to 2026, with policy incentives gradually clarifying, the industry is expected to achieve a new growth rhythm. Overall, while facing short-term challenges such as the high base and cautious end-market sentiment, the long-term structural adjustments in the industry and the increasing penetration of new energy vehicles will provide support for future growth.
BYD and Geely Strengthen Their Dominance, While GAC and Dongfeng Face Pressure;
New Era Automotive Companies Experience Increasing Differentiation
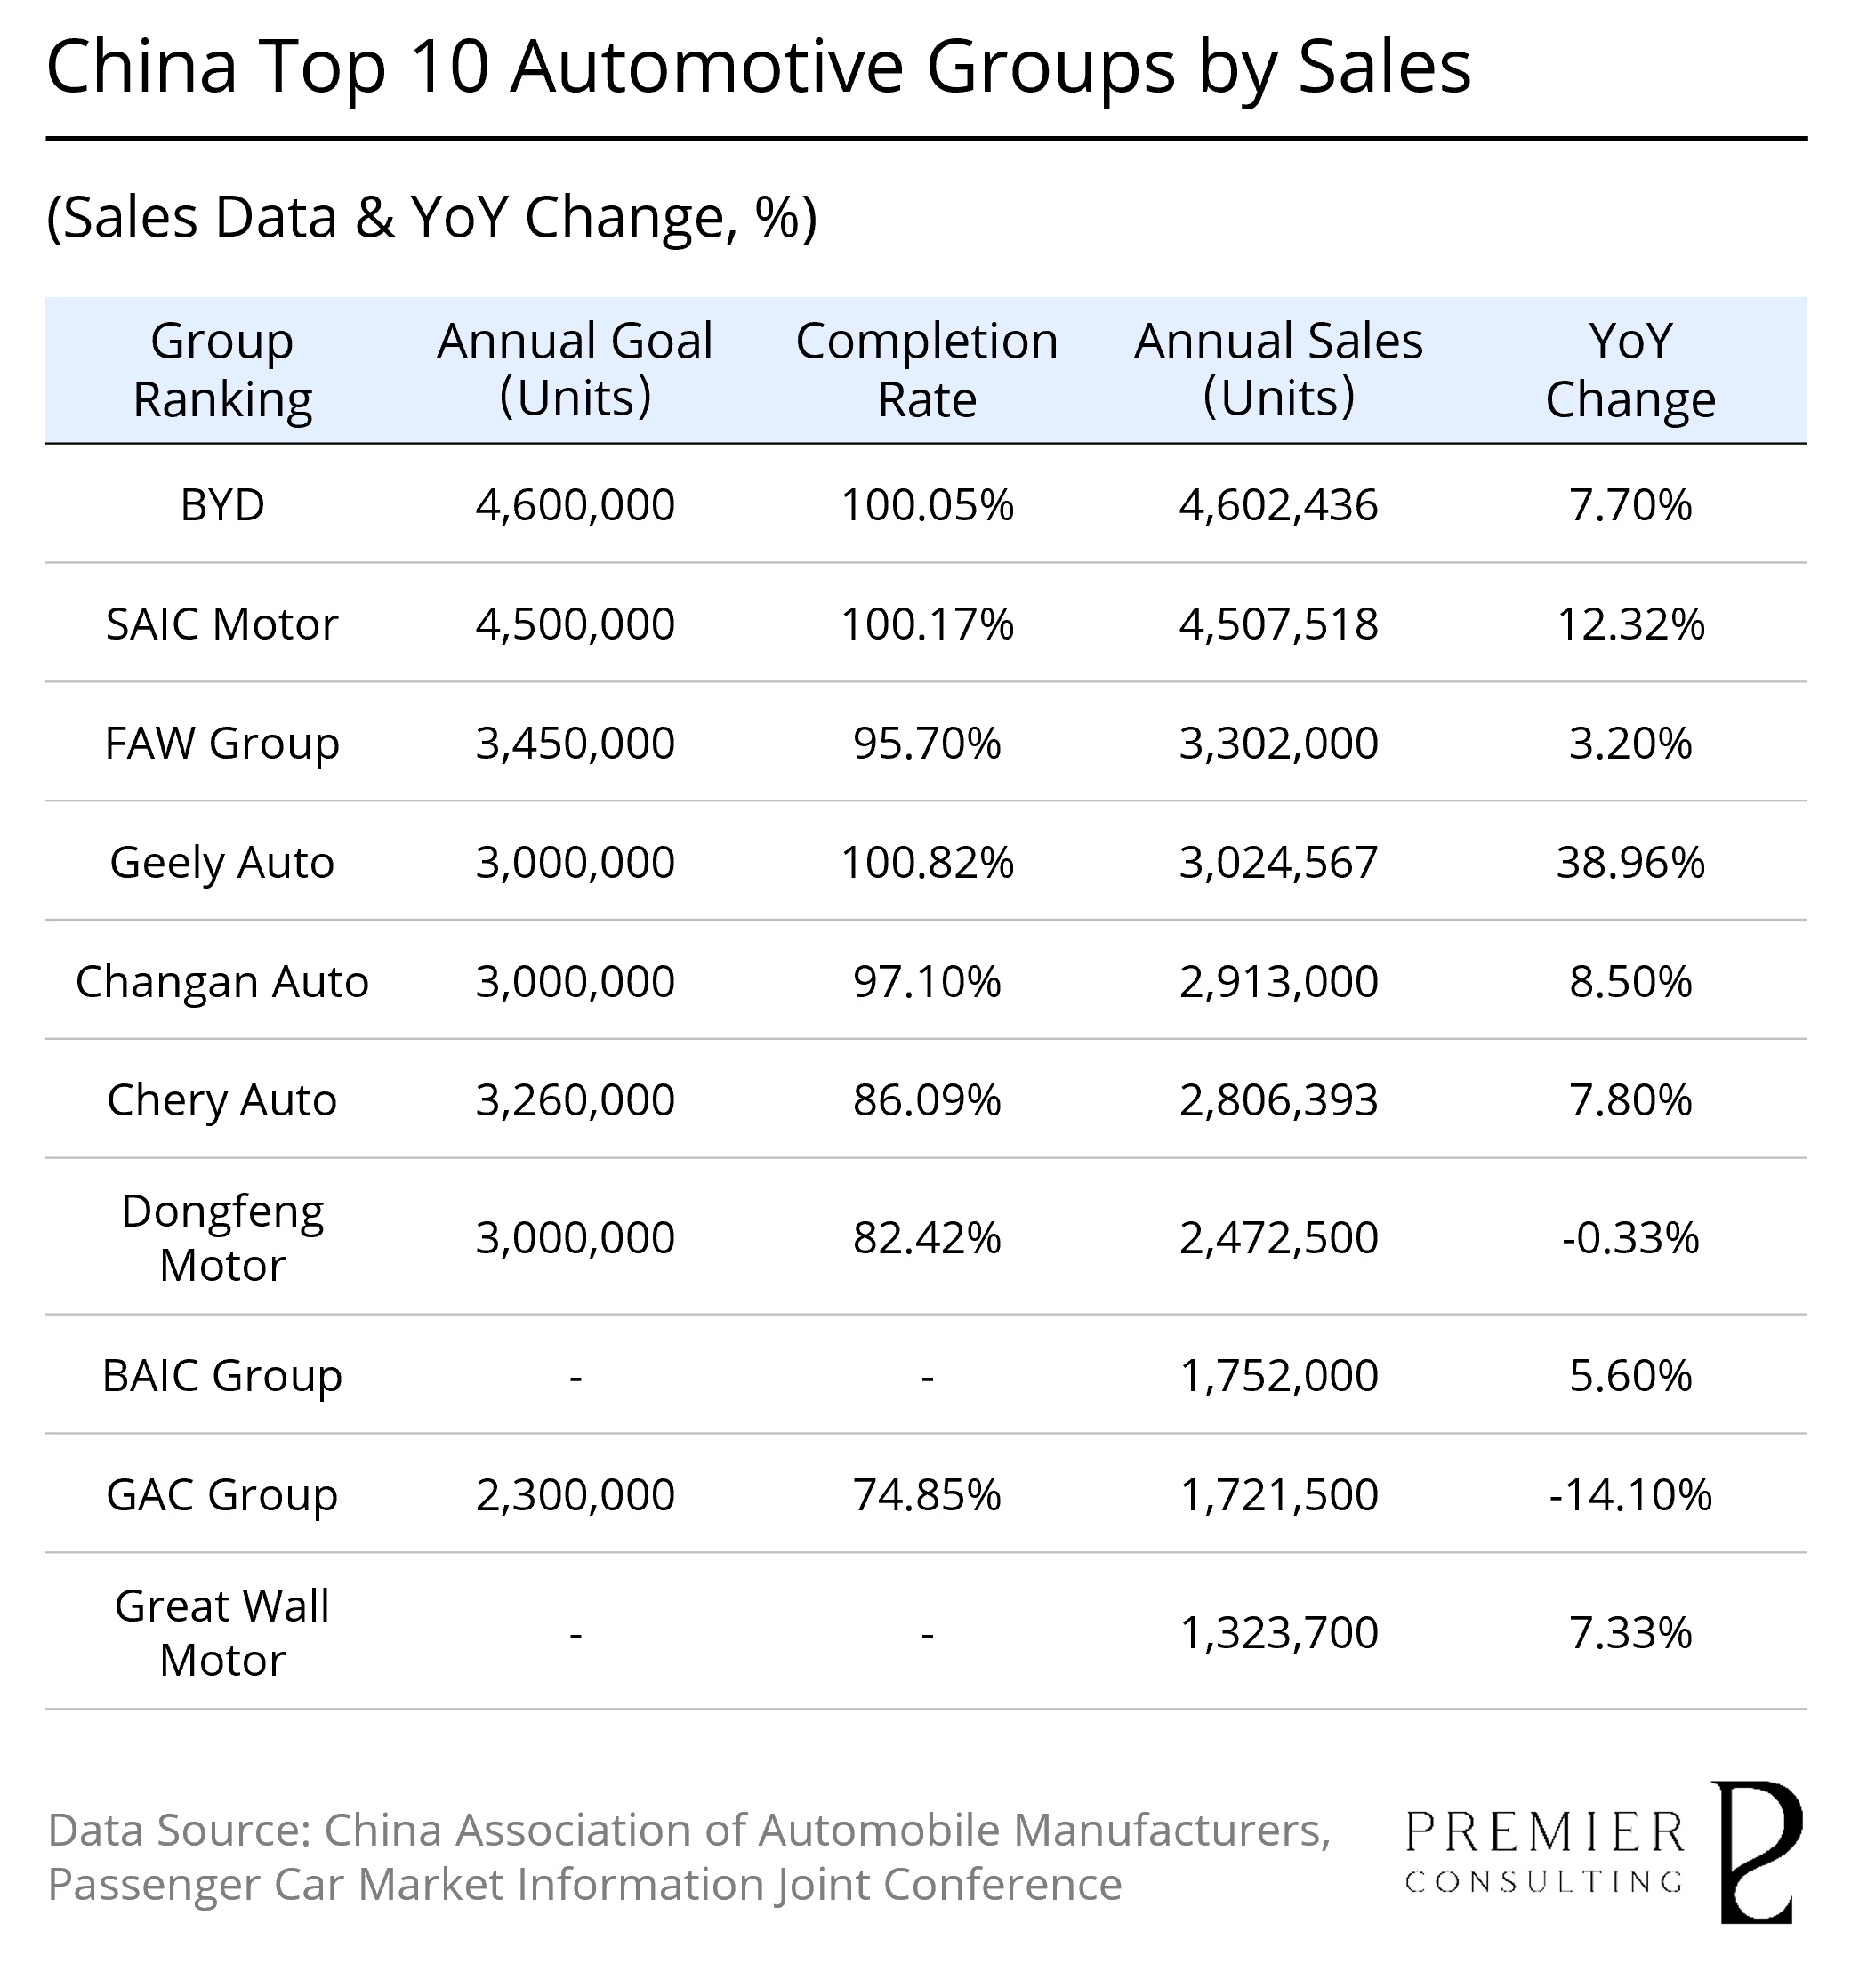
According to the latest statistics, BYD's sales in 2025 reached 4.6024 million units, with overseas sales surpassing 1 million for the first time. The sales of passenger vehicles and pickups overseas totaled 1.0496 million units, marking a year-on-year increase of 145%, allowing BYD to retain its titles as both the top seller of automobiles in China and the global leader in new energy vehicle sales.
Notably, BYD’s sales of pure electric vehicles reached 2.2567 million units in 2025, reflecting a year-on-year growth of nearly 28%, which surpassed Tesla’s annual sales of 1.636 million units.
Geely Auto Also Exceeds Annual Sales Targets; GAC and Dongfeng Groups Face Significant Gaps; Differentiation Intensifies Among New Automakers
Geely Auto exceeded its annual sales target in 2025, achieving a total sales volume of 3.0246 million units, a year-on-year increase of 39%, surpassing its yearly target of 3 million units and setting a new historical record.
In the new energy vehicle sector, Geely's total sales reached 1.6878 million units in 2025, marking a year-on-year growth of 90% and also setting a historical high. The Geely Galaxy brand performed exceptionally well, with annual sales reaching 1.2358 million units, a remarkable increase of 150%, exceeding the "one million Galaxy" sales target.
However, GAC Group and Dongfeng Group experienced significant shortfalls against their targets. GAC's completion rate was below 75%, while Dongfeng's was also below 83%. Brands under GAC, such as GAC Honda, GAC Toyota, and GAC Aion, recorded double-digit declines in annual sales, dragging down the overall performance of the group. Similarly, Dongfeng Group was affected by declining sales of joint venture brands like Dongfeng Honda and Dongfeng Nissan, with overall sales expected to decline slightly year-on-year compared to 2024.
In addition, within the new forces camp, there was significant differentiation in the completion rates among various brands. Leap Motor, XPeng, and Xiaomi Auto all exceeded their annual sales targets, becoming some of the few new forces to achieve their goals in 2025.
Leap Motor emerged as the biggest "dark horse" among new forces in 2025, successfully implementing its fully self-developed and cost-effective strategies, delivering 596,600 vehicles for the year, making it the sales champion among new entrants, with a target achievement rate exceeding 119.3%.
Following closely is Xiaomi Auto, which recorded deliveries of over 50,000 units in December 2025, marking the first time it exceeded that monthly figure. Xiaomi also surpassed its annual delivery target of 350,000 units.
In stark contrast to the above three, most new force brands failed to meet their annual targets. Ideal Auto delivered a total of 406,300 vehicles in 2025, marking an 18.81% decline year-on-year and failing to achieve its annual goal. Initially set at 700,000 vehicles at the beginning of 2025, Ideal's target was adjusted mid-year to 640,000, resulting in a completion rate of 63.48%.
NIO did not meet its annual target of 440,000 vehicles, achieving sales of 326,000 units, a year-on-year growth of 46.9% with a completion rate of 74.1%. This included approximately 178,800 deliveries from the NIO brand, around 107,800 from the LeSabre brand, and approximately 39,400 from the Firefly brand.
Meanwhile, Zeekr aimed for an annual target of 320,000 vehicles, ultimately achieving a completion rate of about 70.03%, with total annual sales of 224,100 units, reflecting a year-on-year growth of 1%.

PRIMARY INDEX REVIEW & PROSPECT
Policy Cycles Intertwining
with Technology Cycles;
Full-Year Recovery and Repair Trajectory
Taking Shape
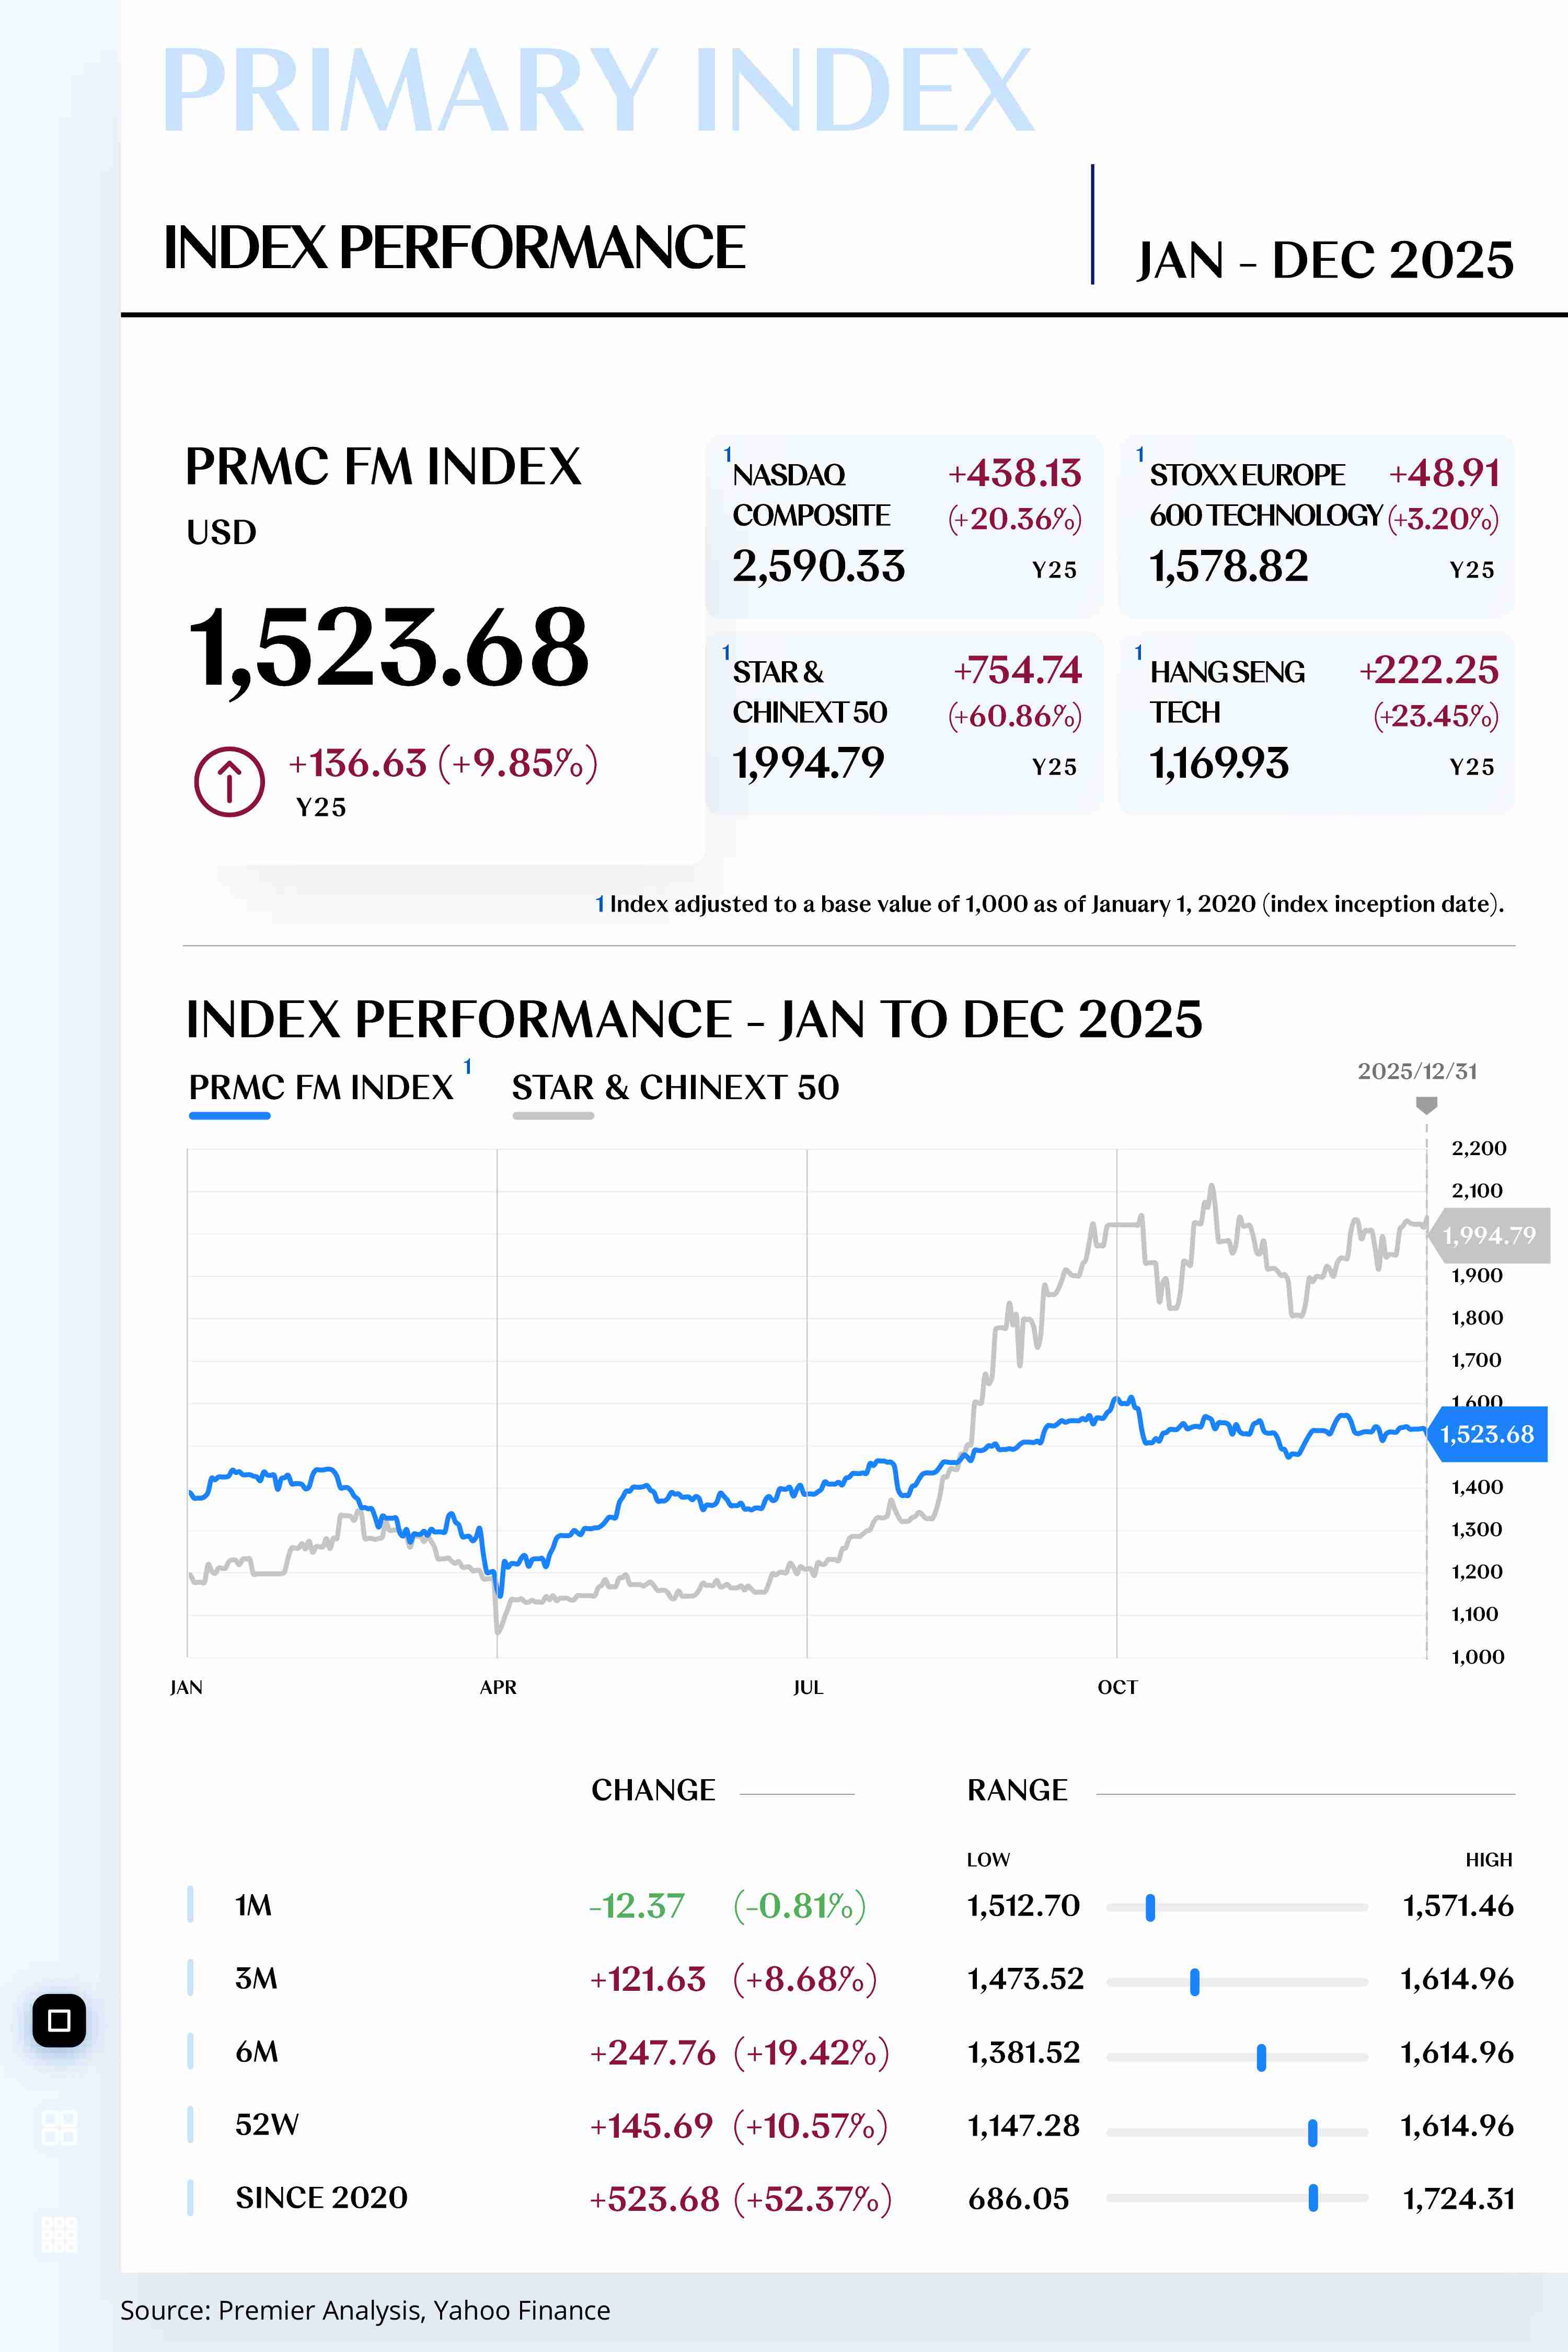
As of December 31, 2025, the PRMC Forward Mobility Index closed at 1,523.68 points, with a cumulative increase of 136.63 points over the year, representing a rise of 9.85%.
In the first quarter of 2025, the Future Mobility Car Index exhibited a downward trend with fluctuations. During this period, the global economy faced significant uncertainty, particularly in the context of changing U.S. tariff policies, which heightened market concerns over the future of the global supply chain and led to depressed investor sentiment. Unexpected shifts in U.S. tariff policies caused volatility in the trading environment related to the global automotive industry, further exacerbating market unease. Although electrification policies in China and Europe continued to support the development of the new energy vehicle market, the short-term uncertainties triggered by U.S. tariff policy shifts induced panic in automotive sector investments, resulting in substantial short-term declines in the index.
As the market entered the second and third quarters, the index gradually exhibited a rebound trend. With the dissipation of market panic, especially following the loosening of U.S. monetary policy and signs of stabilization in the global economy, investor confidence began to recover. Breakthroughs in electric vehicle technology and gradual achievements in global expansion—particularly improvements in battery technology and charging infrastructure—fuels rapid growth in the new energy vehicle market. Additionally, heightened policy support for the automotive industry, driven in particular by green transition policies in China and Europe, helped restore demand for new energy vehicles. Confidence in the future mobility sector gradually rebounded, propelling the index upward.
In the fourth quarter of 2025, the Future Mobility Car Index maintained stable operations with slight fluctuations around its range. During this period, the driving factors for the index's rises and falls reached a dynamic balance, particularly as the global market's adaptability to policy changes increased. After fully digesting uncertainties, investors made more cautious decisions regarding the market. The synchronized advancement of electrification in the U.S. and Europe, coupled with strong growth in China's new energy vehicle exports, contributed to an increasingly stable global market performance. While certain uncertainties remained both internally and externally, the support from technological iterations and policy implementations helped achieve a balance between industry fundamentals and market sentiments, stabilizing the index within a relatively reasonable range.
Looking ahead to 2026, the global economy faces challenges such as rising interest rates, policy uncertainties, and geopolitical risks. However, continued breakthroughs in electrification and intelligent technology will further drive growth in the Future Mobility Car Index. As global carbon emission and environmental regulation tighten, the market penetration rate of new energy vehicles is expected to continue rising, particularly in the Asia-Pacific, European, and American markets, with anticipated demand growth yielding significant profit increases for relevant enterprises. With gradual economic recovery worldwide and the rapid development of new energy and intelligent vehicle technologies, the overall trend of the Future Mobility Car Index in 2026 is predicted to show a stable upward trajectory.
[For more insights, please download the full report]
SECONDARY INDEX REVIEW & PROSPECT
Value Chain Valuation Rebalancing:
Upstream Rebound from Lows,
Midstream Steady Progress,
Downstream Retreat from Highs
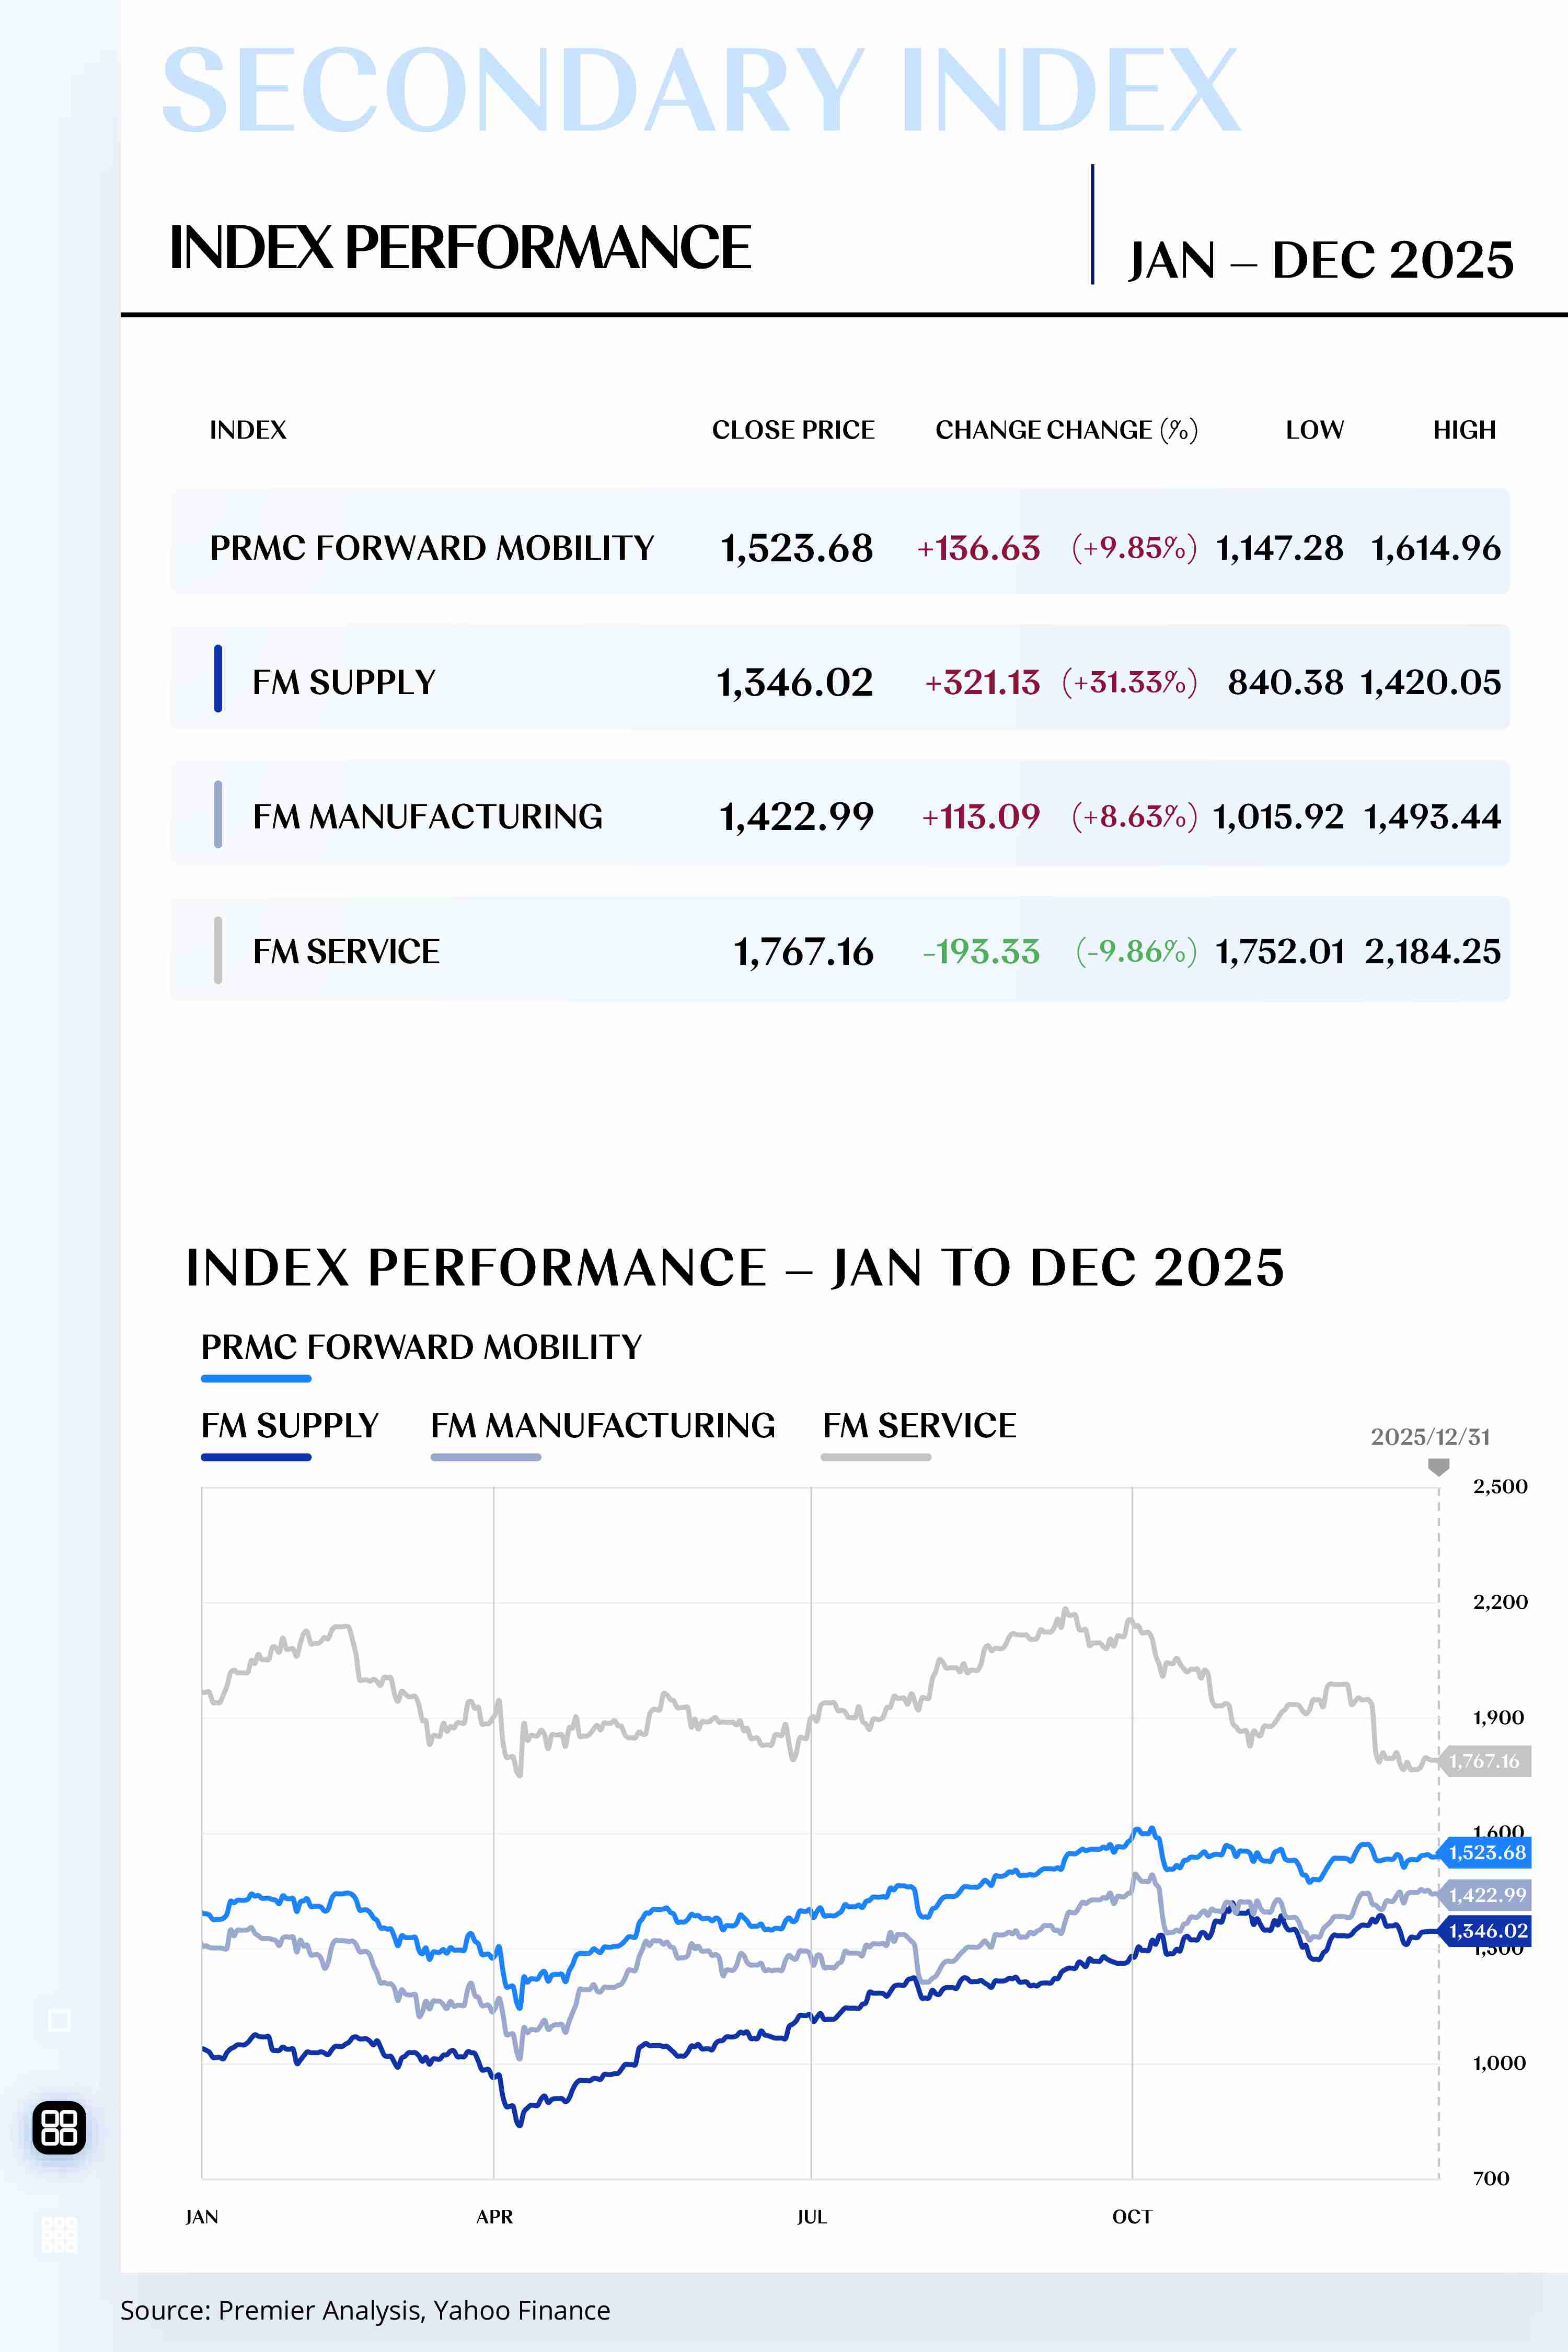
As of December 31, 2025, PRMC Forward Mobility Supply Index closed at 1,346.02 points, with a cumulative increase of 321.13 points over the year, representing a rise of 31.33%.
In 2025, the global macroeconomy continued its moderate recovery, which positively influenced demand for commodities and improved manufacturing sentiment. With inflation gradually easing and major central banks flexibly adjusting their policy tools, improved liquidity has boosted risk appetite. This created a favorable external environment for stock price increases among upstream companies. Additionally, governments in multiple countries accelerated the promotion of electrification and low-carbon transition policies, such as the EU's strict carbon emissions regulations and China's new energy vehicle promotion plans, enhancing market expectations for clean energy, electronic, and intelligent components within the upstream supply chain.
Compared to other secondary indices, upstream index-related companies are more sensitive to fluctuations in resource prices and supply-demand cycles. However, the significant upward movement of the index over the year was not solely driven by these factors. The rapid expansion of global demand for new energy vehicles and intelligent connected vehicles has significantly raised profit expectations for high-value technologies and key raw materials within the upstream supply chain, thereby boosting investor preferences for related sectors.
Examining the performance of specific sub-sectors, the raw materials sector (lithium, nickel, cobalt, copper, etc.) played a notable role in the index's increase. The continued growth of global new energy vehicle production and sales in 2025 led to a massive surge in demand for lithium battery raw materials, keeping related prices elevated through the middle of the year. Since raw materials are a core component of costs, upstream companies such as lithium mining firms and chemical suppliers saw significant improvements in their performance outlook.
The traditional components sector benefited from the recovery in global vehicle production and sales, especially with restored orders in areas such as chassis systems, powertrain systems, and braking systems, leading to overall industry profit improvements. However, this sector's growth leans more toward stable recovery rather than high growth, as it is more impacted by the production and sales rhythm of traditional fuel vehicles than by the rapid expansion benefits of new energy vehicles.
In contrast to traditional components, the new components sector—including electronic control systems, sensors, and vehicle networking hardware—performed impressively. The popularization of intelligent and electric vehicles increased demand for highly integrated electronic components, resulting in higher growth expectations for these upstream companies, with investors assigning higher valuations to high-tech suppliers with strong growth trajectories.
Among them, power battery manufacturers, module suppliers, and electric drive system providers, as the core components of new energy vehicles, performed exceptionally well in 2025. On one hand, improvements in battery energy density and reductions in costs have gradually come to fruition; on the other hand, the sales of electric vehicles from various global automotive brands have reached all-time highs, leading to simultaneous revenue and shipment growth for upstream supply chain companies.
AI-assisted driving, in-car operating systems, and intelligent connected platform suppliers also emerged as significant contributors. As the penetration rate of intelligent driving increases, their market value as module suppliers has been re-evaluated, a trend particularly pronounced in 2025.
Looking ahead to 2026, the Future Mobility Automotive Upstream Index is expected to continue its improving trend, influenced by multiple factors. In a relatively stable resource price environment, cost curves and capacity clearance mechanisms will become core variables affecting profitability quality for upstream companies. As some battery raw material capacities are cleared and some traditional component excess capacities are absorbed, the overall supply-demand tension in the industry may ease, enhancing mid- to long-term profit margins and cash flow, which will positively support the valuation of the upstream sector. However, companies suffering from severe overcapacity and weaker competitiveness may still face downward pressure on profits.
In the context of entering a "growth repricing" phase, investors should focus more on the certainty of profit realization rather than mere valuation elasticity. Accordingly, it is advisable to comprehensively allocate investments in high-growth and high-barrier sub-sectors such as battery materials, advanced electronic components, intelligent driving sensor systems, and key raw materials companies, as these sectors are more likely to achieve profit margin improvements and valuation recovery.
For traditional raw material suppliers, it would be prudent to selectively choose companies with global layouts, stable long-term orders, and strong technological upgrade capabilities while avoiding high allocations to mid- to low-end resource-focused targets to mitigate cyclical volatility risks. Traditional component manufacturers can serve as defensive allocation targets, helping stabilize portfolio performance during periods of macro uncertainty, but should not be viewed as core growth targets.
Simultaneously, it’s important to remain attentive to policy and regulatory trends, particularly regarding environmental protection, carbon emissions, and subsidies and technical standards for new energy vehicles. Upstream companies will need to find optimal configurations between compliance costs and technological investments, which will significantly influence their profitability and valuation changes.
As of December 31, 2025, PRMC Forward Mobility Manufacturing Index closed at 1,422.99 points, with a cumulative increase of 113.09 points over the year, representing a rise of 8.63%.
Throughout the year, the global macroeconomic environment gradually showed a pattern of mild recovery, with major central banks contributing to increased market risk appetite through marginal policy easing. Against this cyclical backdrop, the automotive industry has been steadily restoring production and sales rhythms. As a core hub linking vehicle production and sales with the supply chain, the midstream manufacturing sector has demonstrated strong resilience amid demand recovery, supply chain restructuring, and cost pressure dynamics.
In a fiercely competitive pricing environment, although overall profitability for midstream vehicle manufacturers faced pressure, leading large-scale companies maintained stable profit expectations through economy of scale, cost control, and global expansion. This logic is fully reflected in the midstream index, which, despite a lower increase compared to the upstream, achieved cumulative growth driven by a solid order base and sales resilience.
When observing the performance of specific sub-sectors, in the context of a slow recovery in the global vehicle market, the sales volume of fuel vehicle manufacturers has steadily improved along with a recovery in vehicle sales. Although the transition to new energy has suppressed the long-term growth expectations for traditional fuel vehicles, they remain a primary source of market supply, maintaining a certain order base. This has allowed this sector to sustain profitability through scale and cost control, contributing to the stability of the midstream index.
Manufacturing of new energy vehicles has become a significant pillar of the midstream index's growth this year. Benefiting from a rapid increase in new energy vehicle demand, this sub-sector has recorded improvements in overall orders and capacity utilization rates. Additionally, the launch of new mid-to-large pure electric models in the global market has also positively impacted revenue expectations for related midstream vehicle companies.
Looking ahead to 2026, the midstream index is expected to continue its robust growth under the theme of "platform-based cost reduction + product structure upgrades“. Its performance will also be influenced by technological advancements and upgrades in manufacturing processes. For instance, the promotion of modular and platform-based assembly lines, along with deeper electrification initiatives, will enable leading companies with scale and system integration capabilities to stabilize profits through efficiency improvements and cost optimization.
Investors should focus on midstream manufacturers that possess platform-based manufacturing capabilities, technological barriers, and global market footprints. This includes companies with core technologies and scale advantages in the pure electric and intelligent vehicle segments, as well as leading firms that can enhance efficiency and reduce costs through modular product lines. Additionally, midstream constituents related to hybrid vehicles should also be included in long-term investment portfolios.
As of December 31, 2025, the PRMC Forward Mobility Service Index closed at 1,767.16 points, with a cumulative decline of 193.33 points over the year, representing a drop of 9.86%.
At its core, this decline does not entirely equate to a weakening of the sector's fundamentals; rather, it can be seen as a mean reversion following a repricing of interest rates and risk appetite based on high valuations and expectations.
On one hand, global financing costs remain elevated, and consumer and business capital expenditures are emphasizing certainty, which has suppressed the valuation elasticity of platform-based services and cutting-edge mobility narratives. On the other hand, the automotive supply chain is undergoing structural adjustments amid price competition and inventory rebalancing, causing a misalignment between the short-term profit realization pace in the downstream sector and capital market expectations. Nonetheless, the long-term resilience of the downstream sector remains intact—with financial penetration, after-sales, and subscription services expected to provide a more sustainable cash flow base in the "stock era."
When examining the performance of specific sub-sectors, the automotive finance sector faces pressures but maintains some resilience. Demand is constrained by interest rates and monthly payment pressures, while the supply side is influenced by funding costs and risk control requirements. Companies with stronger customer acquisition capabilities, pricing power, and risk models are more resilient to pressure, whereas companies exposed to subprime customers or with weaker funding are more likely to experience valuation discounts.
The future mobility sector increasingly reflects a shift from "scale narratives" to "cash flow narratives," with the market beginning to reassess platform value using operational cash flow, free cash flow, and capital discipline, rather than solely focusing on order growth rates and penetration ratios. Sub-sectors like low-altitude economics/eVTOL are particularly sensitive to financing windows, order realizability, and regulatory timelines in a high discount rate environment.
The energy and storage sector exhibits more "infrastructure attributes," benefiting long-term from increased electrification penetration and flexibility demands on the grid, but is more constrained in the short term by utilization rates, capital expenditure intensity, and financing conditions. In 2025, pressures on companies related to charging operations and equipment in the secondary market stemmed partially from a chain effect of "slowing EV growth rates—revisions downward on charging demand expectations—delayed profitability turnarounds." Companies with high-density, high-quality locations, locked fleet/commercial customers, and clearer subscription and service revenue structures demonstrate stronger resilience.
Looking ahead to 2026, marginal policies, overseas trade environments, and technology/data regulations will collectively shape the risk premiums for the Future Mobility Automotive Downstream Index. Market pricing for the downstream is expected to emphasize the certainty of profit realization. This indicates that the index is likely to exhibit a "structural rotation" trend—if major global economies continue transitioning from tight monetary policy towards gradual easing, consumer credit conditions and corporate financing pressures are expected to marginally alleviate.
Portfolio allocations for relevant sectors should balance "certainty" and "growth." Investors should prioritize positioning in leading platforms that can turn business scale into cash flow, as well as in data service companies with high renewal rates and strong channel reach within subscription and after-sales ecosystems. The automotive finance sector should prefer institutions with mature risk pricing and risk control models, along with stable funding. Energy replenishment and low-altitude economics can serve as "event and policy elastic positions," but should be selected based on improvements in utilization rates, order locking capabilities, and capital expenditure discipline, while maintaining a higher tolerance for valuation volatility and stricter stop-loss discipline.

Five Pivotal Roles Orchestrating
Glocal Organization Integration

Escaping the Value Trap
in the Intelligent Driving Era

Value Reimagined:
Automotive Industry Outlook 2026
Reconstructing the Cycle, Unlocking a New Value-Chain Equilibrium:
25/26 PRMC Forward Mobility Index Review & Prospect
Aug 02, 2026
To help investors and industry professionals stay balanced amid disruption and act with foresight amid long-term shifts, uphold a long-term investment philosophy, reflect on the key trends of 2025, and capture structural opportunities in the automotive sector of future mobility in 2026.
[2025 in a Nutshell]
• Primary Index: Under the combined influence of the "policy cycle + technology cycle" the index maintained a recovery trend throughout the year. Domestic and foreign policies have supported improved demand expectations, while technological iteration has determined industry discourse power and valuation centers.
• Secondary Index: The secondary index has exhibited rebalancing along the supply chain. The upstream sector is more strongly influenced by resource prices and supply-demand cycles. The midstream manufacturing sector faces pressure from price competition; however, leading companies are stabilizing profitability through efficiency and scale. The downstream channels and services demonstrate long-term resilience driven by replacement cycles, finance, and after-sales ecosystems.
• Constituent Stocks: Market preference for "delivery capability" has significantly increased. Delivery volume and market share are no longer the only metrics; profitability, expense ratios, cash flow, overseas channels, and supply chain control profoundly influence corporate valuations.
• Macroeconomic Trends: A "regional divergence" is observed, with discrepancies in manufacturing cycles and consumption resilience among different economies, resulting in asynchronous recovery in automobile demand. The evolving trade environment and industrial policies are reshaping global supply chains, with tariffs, origin rules, subsidies, and entry barriers structurally overlapping.
• Industry Operations: The focus has shifted from "incremental expansion" to "stock game." Cost reduction through platformization, supply chain negotiation power, and channel efficiency have become critical dividing lines, with demand increasingly driven by the penetration of new energy sources and structural upgrades.
[2026 Outlook]
• Primary Index: Entering the "growth repricing" phase, the marginal effects of policy, overseas trade, and technological regulation collectively determine risk premiums. Opportunities for the index will increasingly arise from the certainty of profit realization rather than mere valuation expansion.
• Secondary Index: The rebalancing logic continues, with future directions becoming increasingly clear. The upstream sector focuses more on "cost curves and capacity clearance," the midstream sector emphasizes "cost reduction through platformization and product structure upgrades," while the downstream sector pays greater attention to "operational efficiency, data-driven engagement, and service subscription penetration."
• Constituent Stocks: High-quality stocks rely on established systems to hedge against cyclical volatility, consolidating their dominant positions. Growth stocks accelerate the commercialization of technology through new models, achieving elevated performance levels. Mid-tier stocks face triple pressures from financing, competition, and policy, with existential questions becoming prominent.
• Macroeconomic Trends: Global demand manifests as "structural highlights under low growth." The maneuvering space of emerging markets, the pace of electrification policies in Europe, consumption and interest rate constraints in North America, and supply chain advantages in Asia will jointly contribute to rebalancing among regions.
• Industry Operations: The domestic price war continues in a "silent" form, with the low-end market remaining under pressure, while the mid-to-high end competes for a new round of pricing power through product structure adjustments. Exports and overseas expansion will become essential strategies to hedge against fluctuations in domestic demand cycles.
Looking back at 2025, the PRMC Forward Mobility Car Index rose further on a stable foundation from the previous year. This underlying logic is not merely a recovery of risk appetite but represents an adjustment process driven by the policy cycle and technology cycle:
Firstly, Marginal support from the policy cycle. Major global economies continuously calibrate expectations between declining inflation and interest rate paths, while domestic signals for steady growth and industrial upgrading are increasingly reinforced, improving industry prosperity expectations and risk premiums in tandem.
Second, Ongoing elevation of the technology cycle. Acceleration in electrification, intelligent technology, power semiconductors, and software capabilities has shifted the competitive focus from “sales expansion” to “system capabilities and long-term winning rates.” The overlay of these two forces has allowed the index to continue its recovery amid fluctuations, anchoring the valuation center more firmly on the mainline of “technological leadership + profit realization.”
Consequently, the secondary index exhibits value rebalancing along the industrial chain. The upstream sector is driven by commodity prices and supply-demand cycles; the midstream sector tests efficiency amid competitive intensity; and the downstream sector consolidates compounding benefits through service-oriented and ecosystem approaches.
As differentiation gradually becomes evident, capital market pricing preferences contract correspondingly. The valuation logic for individual stocks has shifted from "growth narrative" to "delivery capability." Investors are increasingly concerned with whether companies can convert scale advantages into profit quality and transform growth into sustainable cash flows. At the same time, factors such as overseas channel development, localization capabilities, control over key components, and supply chain resilience are beginning to directly affect companies’ operational elasticity and stability amid changes in the external environment. Under this logic, leading performers such as Zhejiang Rongtai, Taotao Automotive, Wuhu Fuzzai, Riying Electronics, and Zhenyu Technology have emerged from the market as capital favorites.
From a macro perspective, the screening logic at the corporate level is further amplified by external variables. The manufacturing cycle and consumption resilience are misaligned between different economies, making it difficult for the recovery pace of automobile demand to be synchronized. Meanwhile, the shift in trade, environmental, and industrial policies has reshaped the boundaries of global supply chains, with tariffs, origin rules, subsidy arrangements, and entry barriers creating systematic constraints that directly impact companies' cost curves, product mix, and overseas market strategies.
At the industry level, the transition in 2025 marks the industry's shift from "incremental expansion" to the pre-phase of "stock competition": the price war continues, with demand increments increasingly derived from rising penetration of new energy and structural upgrades, while profit increments predominantly stem from product structure optimization, overseas market expansion, and the realization of full lifecycle operations (services, finance, subscriptions, and data monetization).
The overarching theme for the index in 2026 is expected to shift from “confidence recovery” to “repricing”. As marginal policy support converges, overseas trade friction persists, and technological/compliance regulations tighten, industry risk premiums will undergo systematic reassessment. The capital market's tolerance for long-term narratives will decrease, with pricing anchors becoming more focused on verifiable profitability quality, cash flow resilience, and delivery cadence.
In other words, the primary source of the index's upward movement will stem from the stability of valuation centers and structural uplift driven by “profit certainty,” rather than the broad-based valuation expansion driven by sentiment. Companies capable of consistently delivering profits and free cash flow in uncertain environments are more likely to become core contributors to the index's resilience.
Within this framework, the rebalancing of the secondary index will evolve from a phase-driven phenomenon into a normalized pattern. The core observation point for the upstream sector will be “cost curves + capacity clearance”. As supply and demand shift from a tight balance to recalibration, price and profit elasticity will revert to fundamentals. The midstream manufacturing sector remains the battleground for price competition, but the key to victory will shift from “scale expansion” to a combination of “platform-based cost reduction + product structure upgrades”. Only those leading companies that can convert scale advantages into efficiency and solidify that efficiency into profits will stabilize their gross profit floor and secure relative pricing power. The focus for downstream channels and services will center on three main lines: “enhancing operational efficiency, improving data-driven engagement capabilities, and increasing subscription penetration”. Participants who can deepen user lifecycle management and transition services and financing from one-off promotions to sustainable recurring cash flows will achieve higher elastic returns as demand rebounds.
Consequently, the competitive landscape among individual stocks will also be restructured. Quality compounders such as CATL, NVIDIA, Uber Technologies, Geely Auto, and BYD, leveraging mature supply chain systems, global layouts, and ample financial strength, can effectively hedge against cyclical risks and stabilize operational rhythms during market volatility, even capturing market share amid an overall industry contraction, further consolidating their leading positions.
Growth Accelerators such as Amprius, Mele Technology, Qianli Technology, NIO, and Wan Feng Auto Wheel will encounter more opportunities arising from the commercialization of new models and technologies. The key lies not in having more cutting-edge concepts, but in achieving faster conversions and clearer unit economic benefits. Only those enterprises capable of quickly translating technological advantages into scalable revenues and improved profit structures will possess the potential for significant performance leaps.
However, mid-tier companies face increasingly severe challenges. A tightening financing environment, intensified price competition, and stricter policies have turned cash flow and compliance costs into stringent survival constraints, making market scrutiny more direct and harsh.
From a macro perspective, emerging markets still offer room for increased mobility rates and expansion of vehicle ownership, providing sustainable incremental support for exports and international expansion. The electrification process in Europe is more driven by institutional and regulatory factors, yet the simultaneous rise in industry protectionism and compliance thresholds compels companies to adapt through more flexible power combination strategies and deeper localization efforts. North American demand remains constrained by interest rates and consumer spending, with recovery paths characterized by "slow increases and heightened differentiation“. Asia's supply chain advantages continue to be a crucial pillar for the global automotive industry; however, in the context of adjustments to trade rules and strengthened origin requirements, “supply chain advantages” are shifting from mere cost advantages to a comprehensive competitiveness anchored in industrial synergy, compliance capabilities, and global operational frameworks.
The competitive environment in 2026 will resemble a “low intensity, long cycle” battle of attrition: price competition is expected to continue in a more subtle and persistent manner, with sustained pressure on the lower-end market and profit margins being repeatedly compressed through multiple rounds of contention. The mid-to-high end market will compete for a new round of pricing power by reconstructing product structures and value systems—systemic values such as intelligent experiences, three-electric efficiency, comfort, and safety will better define premium boundaries and brand tiers than single-point parameters.
Meanwhile, export and overseas expansion will transition from being “growth options” to key levers for “cyclical hedging and structural upgrades.” Their significance lies not only in contributing to sales increases but also in enhancing capacity utilization, achieving cost dilution, and strengthening brand momentum through external expansion, while validating product and organizational capabilities in the global market.

Shanghai
11/F · WSH Building
POLY GREENLAND PLAZA
198 Jingzhou Road
Shanghai PRC · 200082
London
OFFICE SUITE 29A · 3/F
23 Wharf Street
London England · SE8 3GG
Hongkong
9/F · Tower A
NEW MANDARIN PLAZA
14 Science Museum Road
Hongkong SAR · 999077